Overview
What does it do?
ClusterCockpit is a framework for job-specific performance and power monitoring on distributed HPC clusters. It is designed with a strong focus on ease of installation and maintenance, high security, and intuitive usability.
ClusterCockpit provides a modern web interface offering tailored views for different user groups.
For HPC users
- A comprehensive overview of running and completed batch jobs
- Access to a wide range of job-level metrics, including hardware performance counters and power data
- Flexible sorting, filtering, and tagging of jobs
- Support for identifying performance bottlenecks and inefficient resource usage
For support staff
- Unified access to job data across multiple clusters
- Advanced filtering and sorting by job, user, or system
- Customizable statistical analyses with aggregated job and user data
- A cluster status dashboard for quick detection of system-wide issues
For administrators
- Single-file deployment of the ClusterCockpit web backend with Systemd integration
- Node agents available as RPM and DEB packages
- Multiple authentication options, including local accounts, LDAP, OpenID Connect, and JWT
- A comprehensive REST/NATS API for integration with batch schedulers and existing monitoring infrastructures
ClusterCockpit is used in production at several HPC computing centers, demonstrating its maturity and suitability for real-world HPC operations (List of users.)
How does it work?
Simple setup
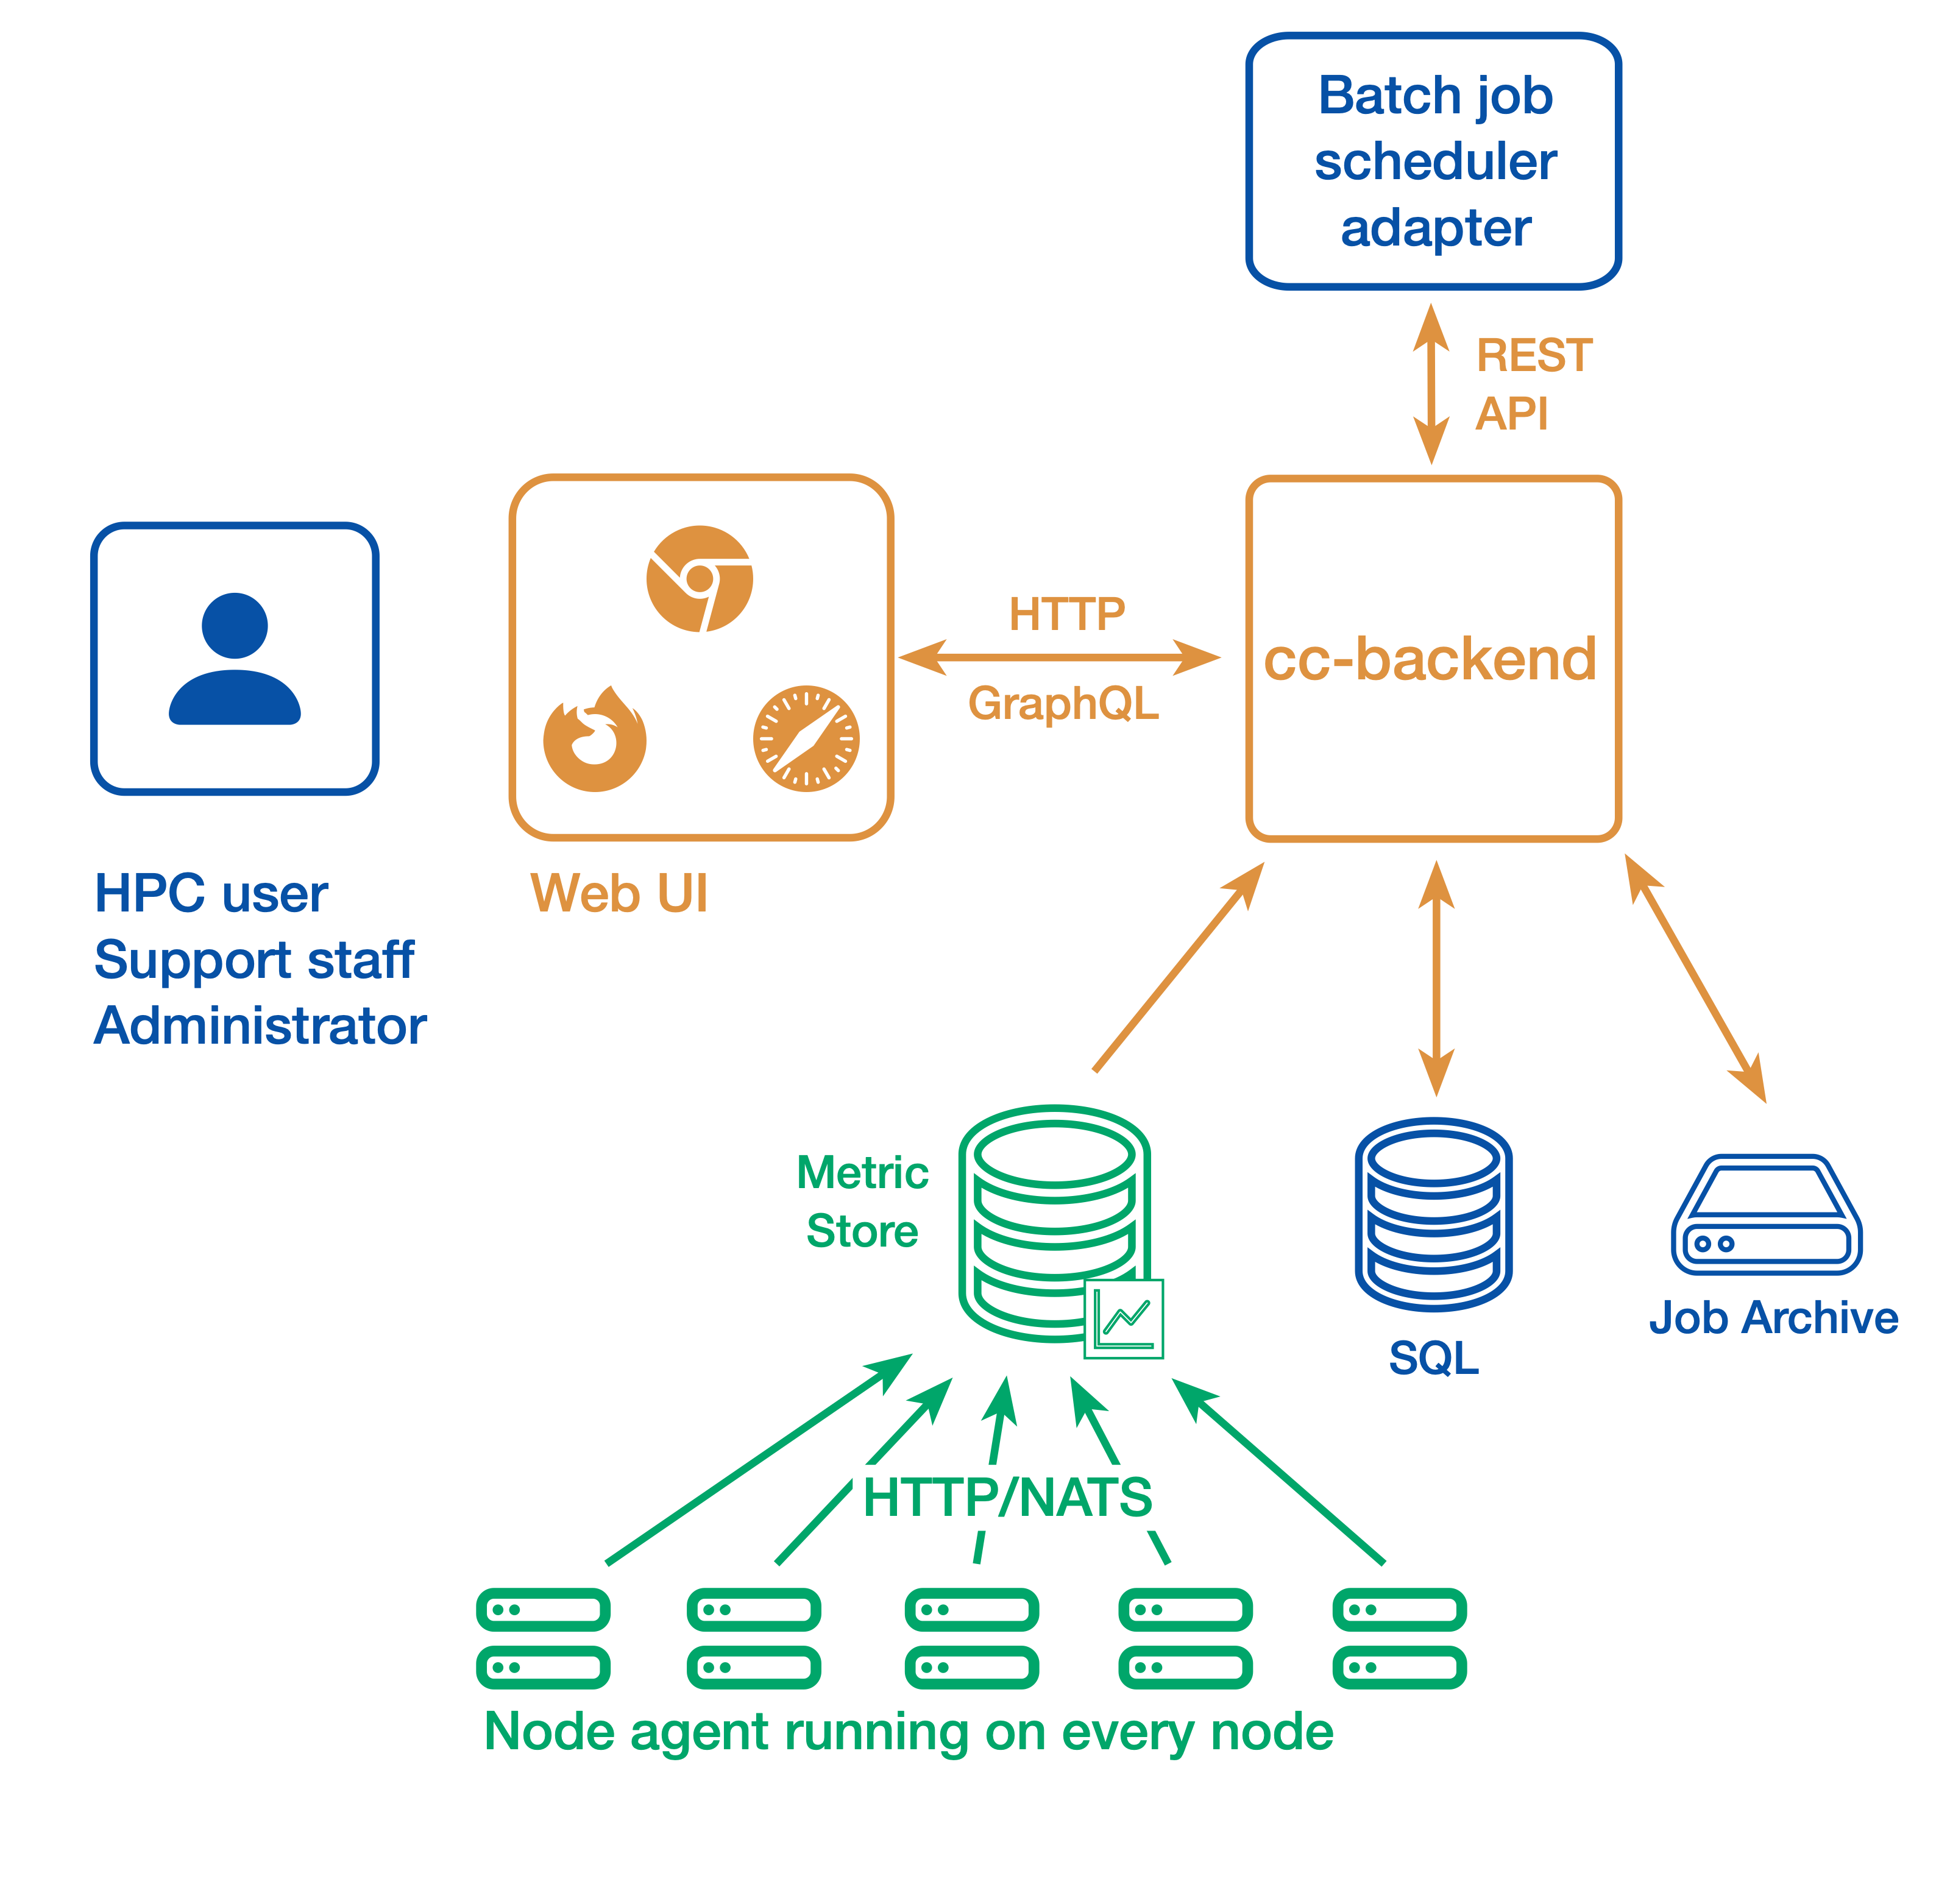
In a simple setup ClusterCockpit consists of the following components:
- The web user interface and API backend: cc-backend
- The node-level metric collection agent (one per compute node): cc-metric-collector
- The Slurm scheduler adapter: cc-slurm-adapter
Node-level metrics are collected continuously by the metric collector and sent to the backend at fixed intervals. Job metadata is provided by one Slurm adapter per Slurm Controller or by a custom adapter for other batch job schedulers and is transmitted to cc-backend via HTTP or NATS.
Job metadata is stored in an internal SQLite database. For running jobs, cc-backend queries an internal metrics store to retrieve all required time-series data. Once a job has finished, its complete dataset—including metadata and metrics—is persisted to a JSON based job archive.
cc-backend supports multiple archive backends:
- A file-based archive
- A single-file SQLite-based archive
- An S3-compatible object store
Finished jobs are loaded on demand from the job archive. The internal metrics store uses a memory pool, retaining time-series data only as long as used by running jobs. This design enables data retention policies and allows ClusterCockpit to operate with minimal maintenance overhead.
Alternative setup
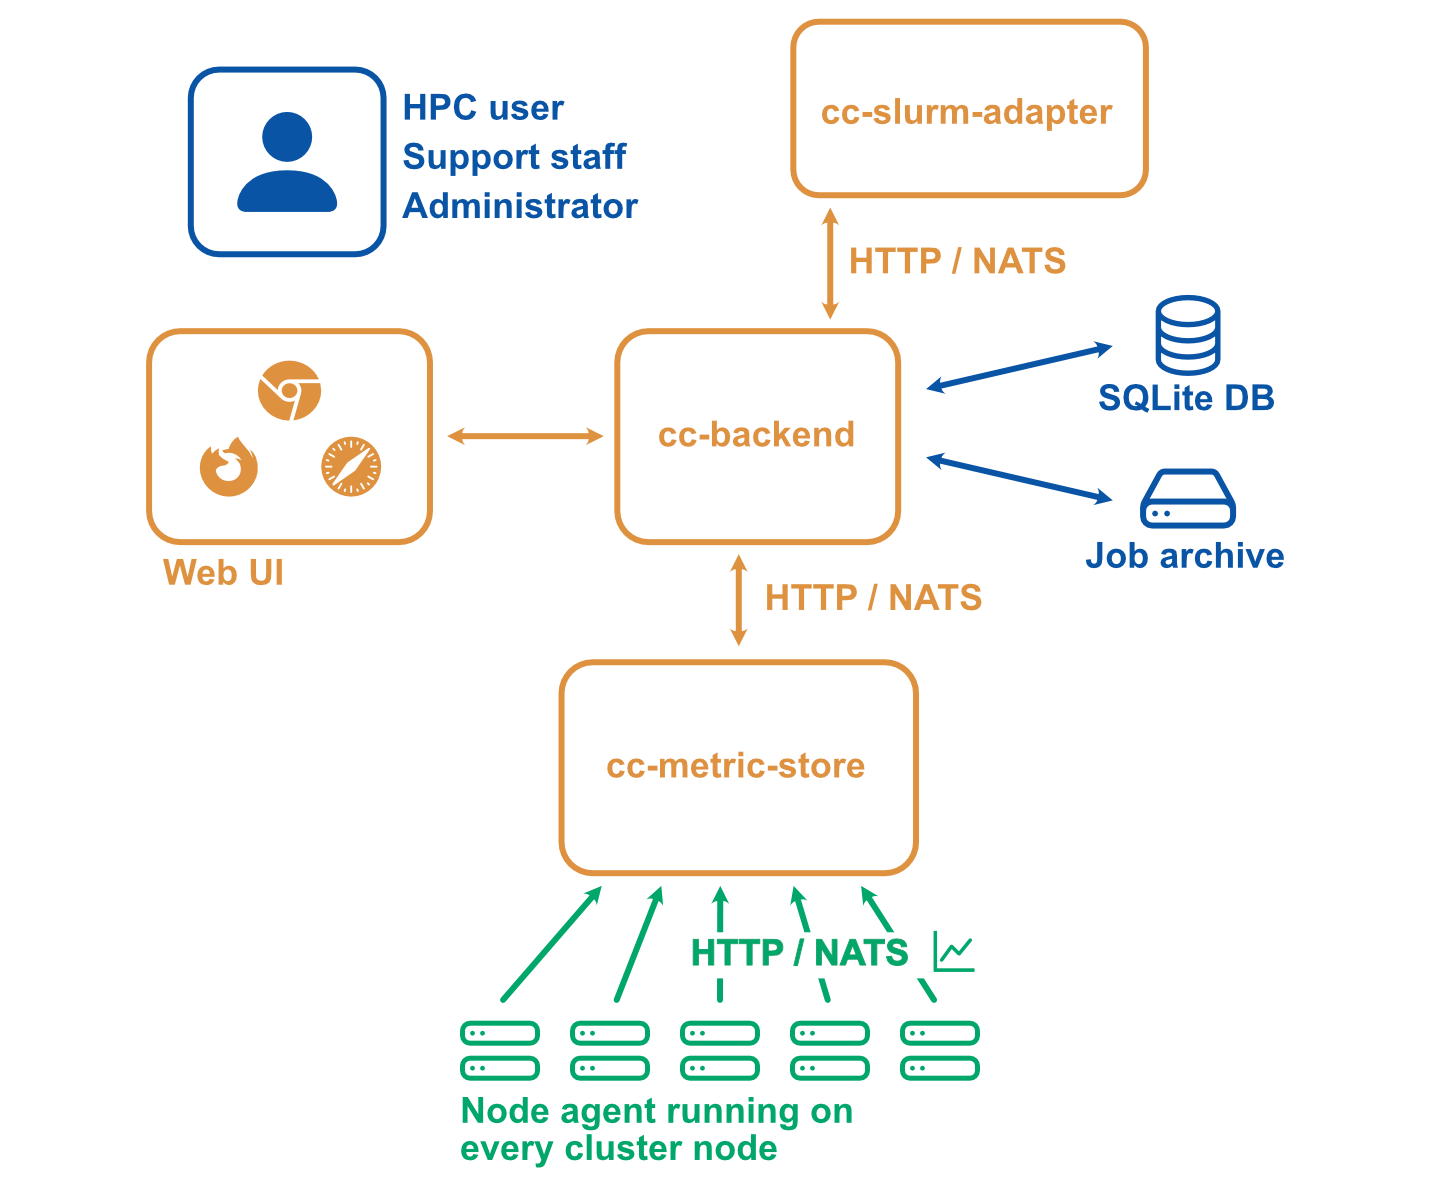
A more complicated setup with multiple clusters or stricter requirements with regard to security may look as follows:
- The web user interface and API backend (There is always only one backend instance): cc-backend
- The node-level metric collection agent (one per compute node): cc-metric-collector
- The Slurm scheduler adapter (one per Slurm controller): cc-slurm-adapter
- Optional: External cc-metric-store. Can be one for all clusters, or any other distribution up to one per subcluster. You can also mix to use the internal metric store for some clusters and one or more external metric stores for others.
The rest of the architecture is the same as above.
Where to go next?
- Getting Started: Set up and explore a local ClusterCockpit demo
- Installation manual: Plan, configure, and deploy a production ClusterCockpit installation
- User guide: Learn how to use the ClusterCockpit web interface
Documentation Structure
- Tutorials: Step-by-step guides for configuring and deploying ClusterCockpit
- How-to Guides: Practical solutions to common tasks and problems
- Explanation: Background information, concepts, and terminology used in ClusterCockpit
- Reference: Detailed technical reference documentation
Feedback
Was this page helpful?
Glad to hear it! Please tell us how we can improve.
Sorry to hear that. Please tell us how we can improve.