This is the multi-page printable view of this section. Click here to print.
Documentation
- 1: Overview
- 2: Release specific infos
- 3: Getting Started
- 4: Tutorials
- 4.1: Plan overall ClusterCockpit architecture
- 4.2: ClusterCockpit installation manual
- 4.3: Decide on metric list
- 4.4: Deployment
- 4.5: Setup of cc-metric-store
- 4.6: Setup of cc-metric-collector
- 4.7: Setup of cc-backend
- 5: How-to Guides
- 5.1: Configure retention policies
- 5.2: How to set up hierarchical metric collection
- 5.3: Database migrations
- 5.4: Job archive migrations
- 5.5:
- 5.6: Hands-On Demo
- 5.7: How to add a MOD notification banner
- 5.8: How to create a `cluster.json` file
- 5.9: How to customize cc-backend
- 5.10: How to deploy and update cc-backend
- 5.11: How to enable and configure auto-tagging
- 5.12: How to generate JWT tokens
- 5.13: How to plan and configure resampling
- 5.14: How to regenerate the Swagger UI documentation
- 5.15: How to setup a systemd service
- 5.16: How to use the REST API Endpoints
- 5.17: How to use the Swagger UI documentation
- 6: Explanation
- 6.1: Authentication
- 6.2: Configuration Management
- 6.3: InfluxDB Line Protocol
- 6.4: JSON Web Token
- 6.5: Metric Store
- 6.6: NATS messaging
- 6.7: Roles
- 7: Reference
- 7.1: cc-backend
- 7.1.1: Command Line
- 7.1.2: Configuration
- 7.1.3: Environment
- 7.1.4: REST API
- 7.1.5: Authentication Handbook
- 7.1.6: Job Archive Handbook
- 7.1.7: Schemas
- 7.1.7.1: Application Config Schema
- 7.1.7.2: Cluster Schema
- 7.1.7.3: Job Data Schema
- 7.1.7.4: Job Statistics Schema
- 7.1.7.5: Unit Schema
- 7.1.7.6: Job Archive Metadata Schema
- 7.1.7.7: Job Archive Metrics Data Schema
- 7.1.8: Tools
- 7.1.8.1: archive-manager
- 7.1.8.2: archive-migration
- 7.1.8.3: convert-pem-pubkey
- 7.1.8.4: gen-keypair
- 7.1.8.5: grepCCLog.pl
- 7.1.8.6: Metric Generator Script
- 7.2: cc-metric-store
- 7.2.1: Command Line
- 7.2.2: Configuration
- 7.2.3: Metric Store REST API
- 7.3: cc-metric-collector
- 7.3.1: Configuration
- 7.3.2: Installation
- 7.3.3: Usage
- 7.3.4: Metric Router
- 7.3.5: Collectors
- 7.4: cc-slurm-adapter
- 7.4.1: Installation
- 7.4.2: cc-slurm-adapter Configuration
- 7.4.3: Daemon Setup
- 7.4.4: Prolog/Epilog Hooks
- 7.4.5: Usage
- 7.4.6: Troubleshooting
- 7.4.7: Architecture
- 7.4.8: API Integration
- 8: Web Interface
- 9: Contribution Guidelines
1 - Overview
What does it do?
ClusterCockpit is a framework for job-specific performance and power monitoring on distributed HPC clusters. It is designed with a strong focus on ease of installation and maintenance, high security, and intuitive usability.
ClusterCockpit provides a modern web interface offering tailored views for different user groups.
For HPC users
- A comprehensive overview of running and completed batch jobs
- Access to a wide range of job-level metrics, including hardware performance counters and power data
- Flexible sorting, filtering, and tagging of jobs
- Support for identifying performance bottlenecks and inefficient resource usage
For support staff
- Unified access to job data across multiple clusters
- Advanced filtering and sorting by job, user, or system
- Customizable statistical analyses with aggregated job and user data
- A cluster status dashboard for quick detection of system-wide issues
For administrators
- Single-file deployment of the ClusterCockpit web backend with Systemd integration
- Node agents available as RPM and DEB packages
- Multiple authentication options, including local accounts, LDAP, OpenID Connect, and JWT
- A comprehensive REST/NATS API for integration with batch schedulers and existing monitoring infrastructures
ClusterCockpit is used in production at several HPC computing centers, demonstrating its maturity and suitability for real-world HPC operations (List of users.)
How does it work?
Simple setup
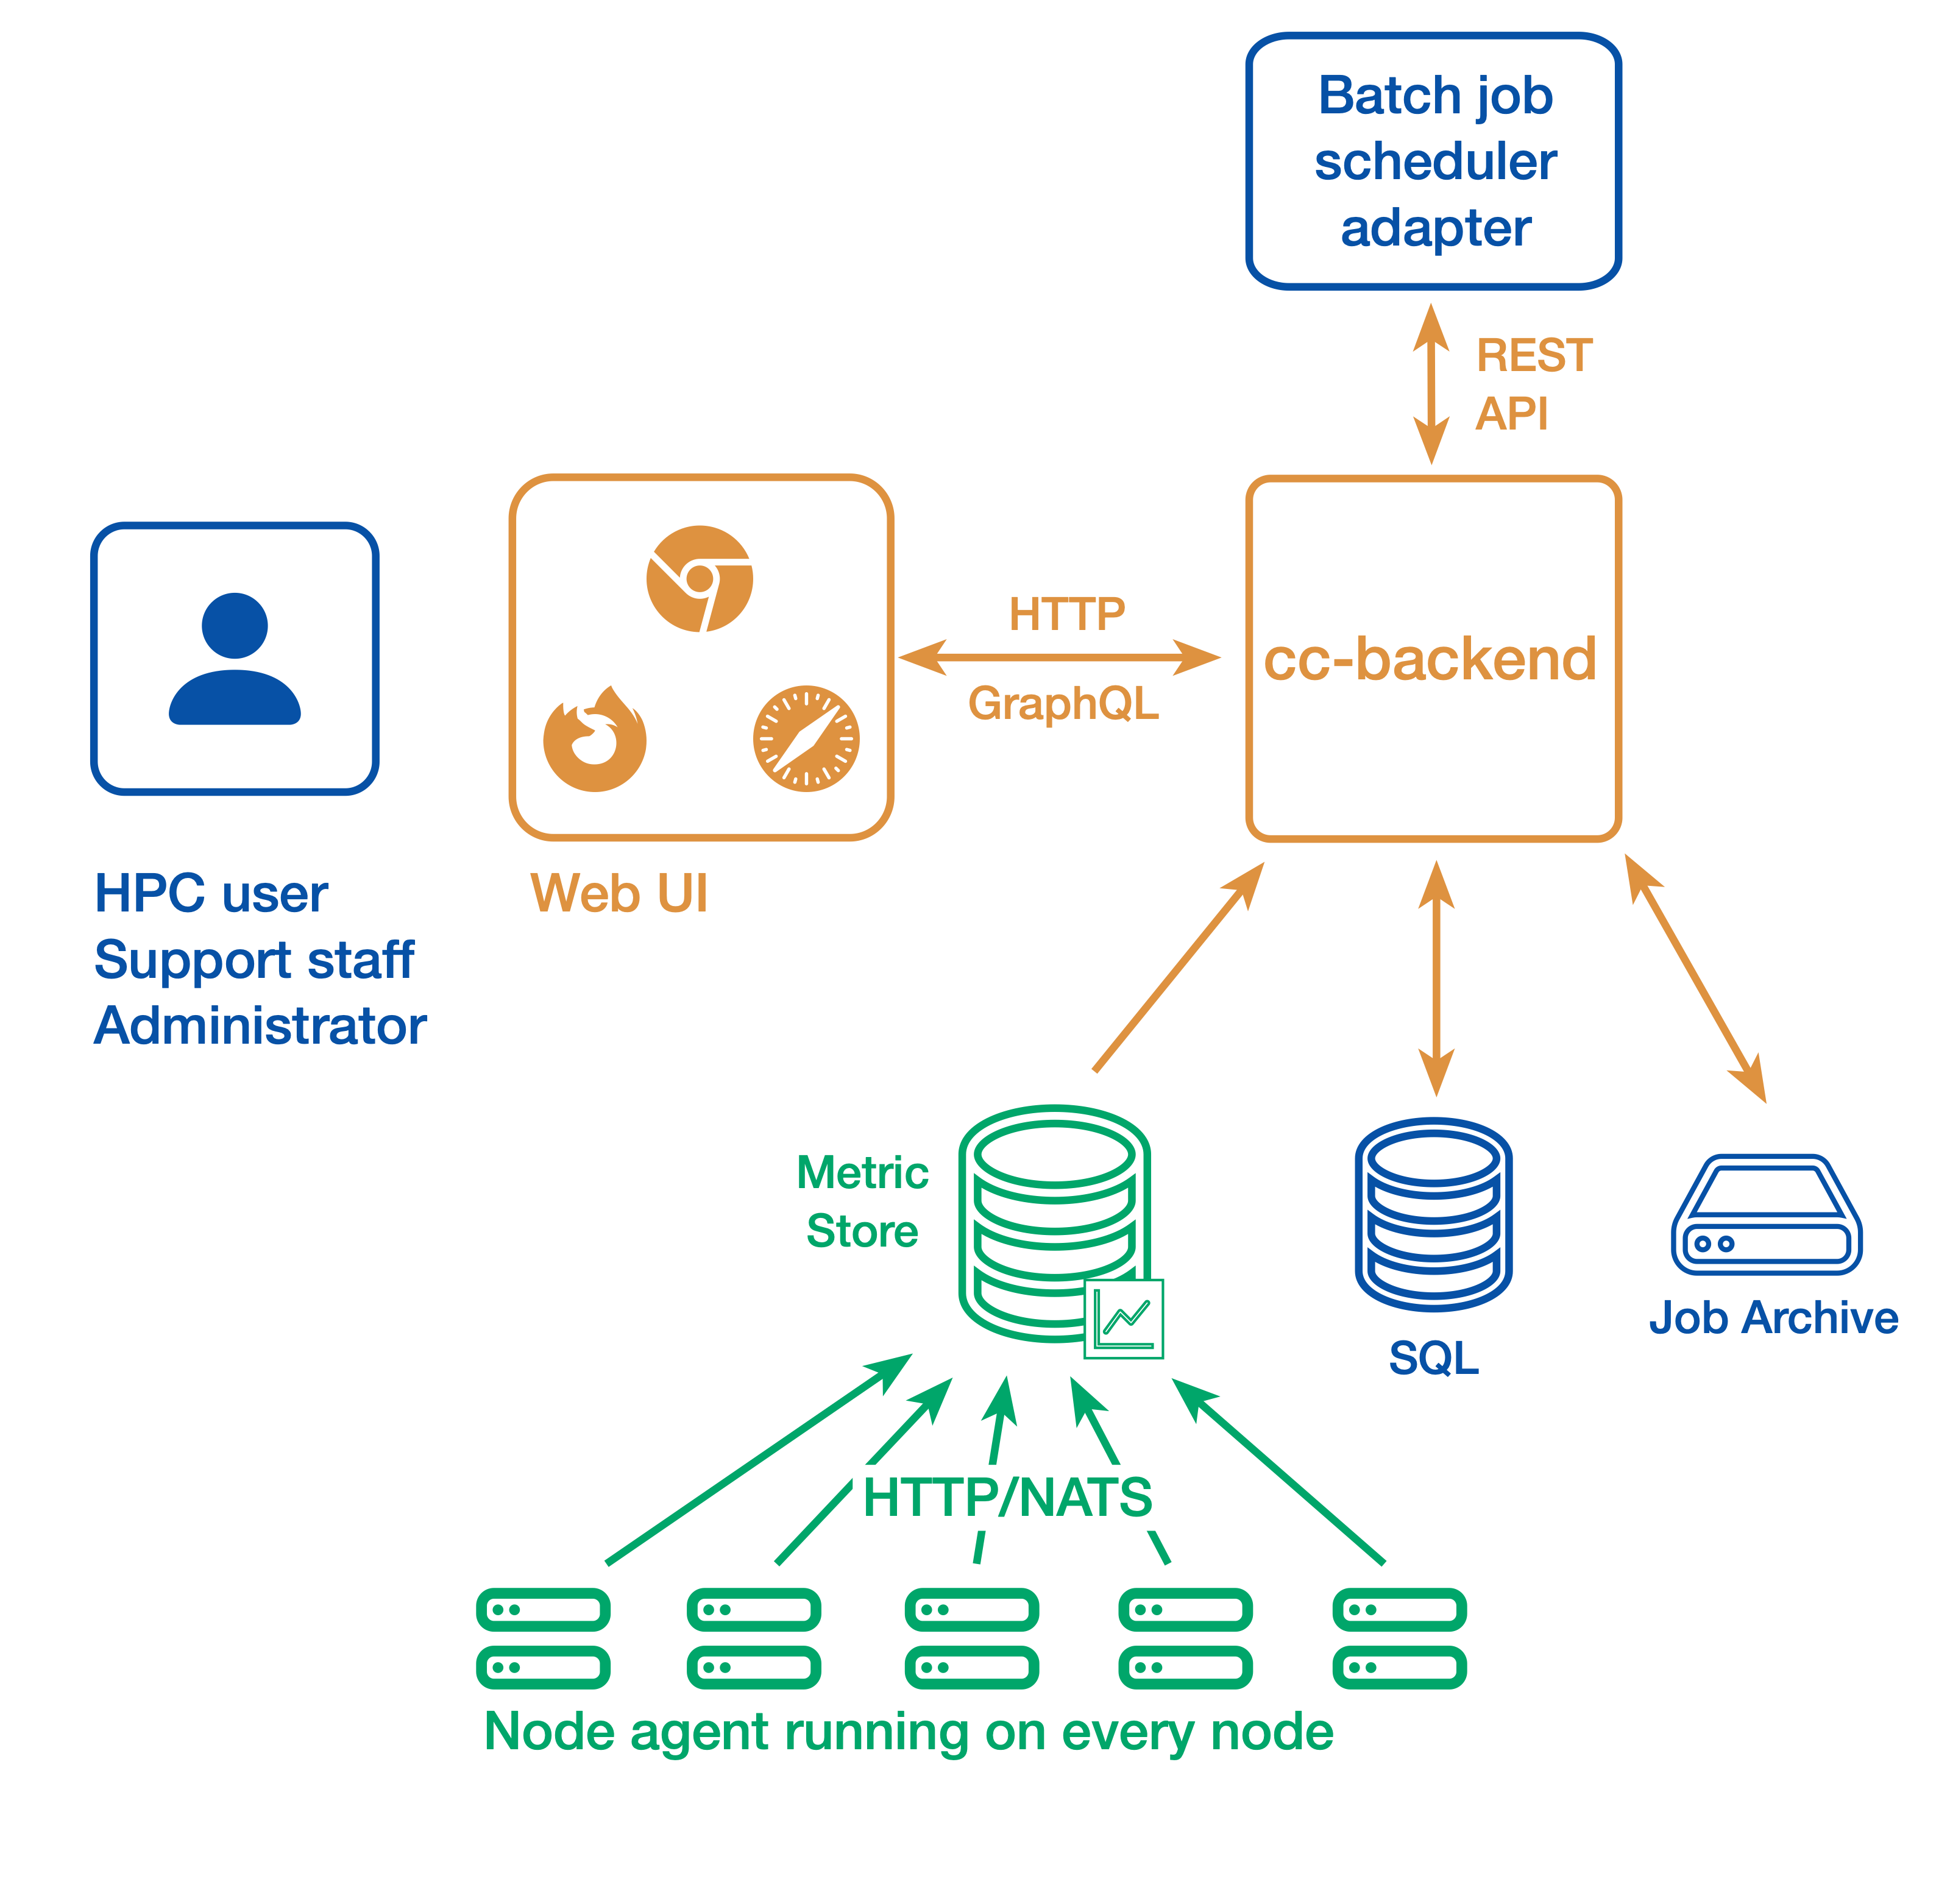
In a simple setup ClusterCockpit consists of the following components:
- The web user interface and API backend: cc-backend
- The node-level metric collection agent (one per compute node): cc-metric-collector
- The Slurm scheduler adapter: cc-slurm-adapter
Node-level metrics are collected continuously by the metric collector and sent to the backend at fixed intervals. Job metadata is provided by one Slurm adapter per Slurm Controller or by a custom adapter for other batch job schedulers and is transmitted to cc-backend via HTTP or NATS.
Job metadata is stored in an internal SQLite database. For running jobs, cc-backend queries an internal metrics store to retrieve all required time-series data. Once a job has finished, its complete dataset—including metadata and metrics—is persisted to a JSON based job archive.
cc-backend supports multiple archive backends:
- A file-based archive
- A single-file SQLite-based archive
- An S3-compatible object store
Finished jobs are loaded on demand from the job archive. The internal metrics store uses a memory pool, retaining time-series data only as long as used by running jobs. This design enables data retention policies and allows ClusterCockpit to operate with minimal maintenance overhead.
Alternative setup
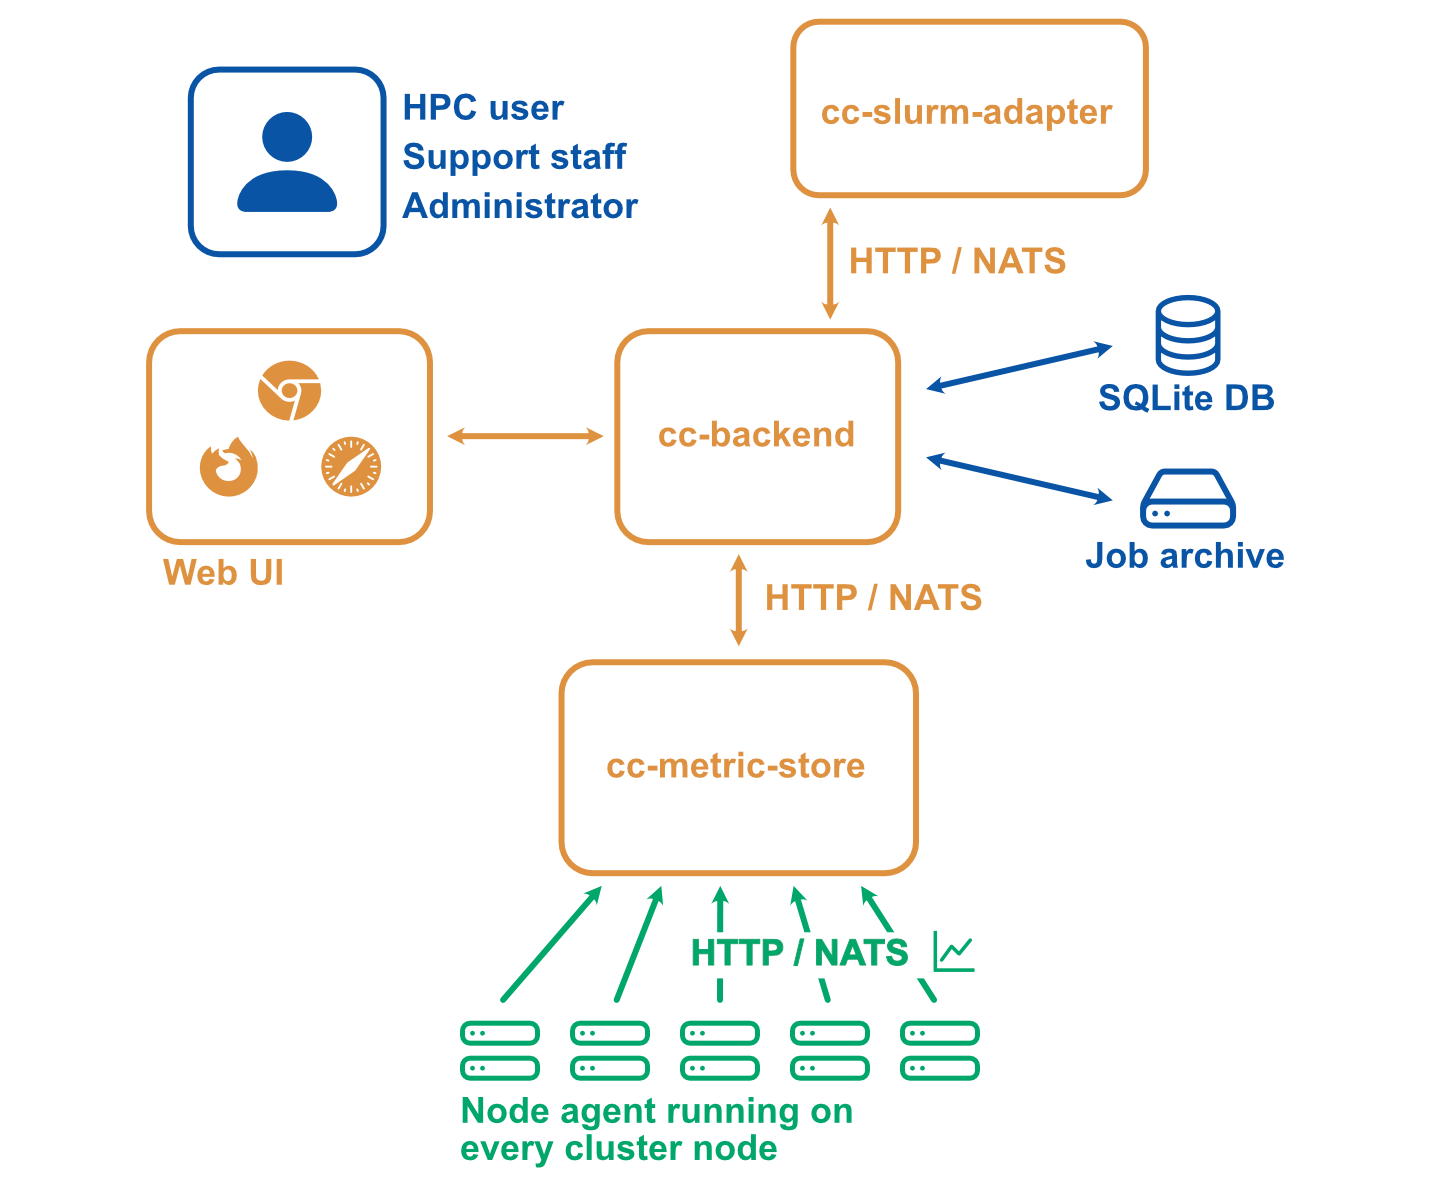
A more complicated setup with multiple clusters or stricter requirements with regard to security may look as follows:
- The web user interface and API backend (There is always only one backend instance): cc-backend
- The node-level metric collection agent (one per compute node): cc-metric-collector
- The Slurm scheduler adapter (one per Slurm controller): cc-slurm-adapter
- Optional: External cc-metric-store. Can be one for all clusters, or any other distribution up to one per subcluster. You can also mix to use the internal metric store for some clusters and one or more external metric stores for others.
The rest of the architecture is the same as above.
Where to go next?
- Getting Started: Set up and explore a local ClusterCockpit demo
- Installation manual: Plan, configure, and deploy a production ClusterCockpit installation
- User guide: Learn how to use the ClusterCockpit web interface
Documentation Structure
- Tutorials: Step-by-step guides for configuring and deploying ClusterCockpit
- How-to Guides: Practical solutions to common tasks and problems
- Explanation: Background information, concepts, and terminology used in ClusterCockpit
- Reference: Detailed technical reference documentation
2 - Release specific infos
cc-backend version 1.5.0
Supports job archive version 3 and database version 10.
Breaking changes
Configuration changes
- JSON attribute naming: All JSON configuration attributes now use
kebab-casestyle consistently (e.g.,api-allowed-ipsinstead ofapiAllowedIPs). Update yourconfig.jsonaccordingly. - Removed
disable-archiveoption: This obsolete configuration option has been removed. - Removed
clustersconfig section: The separate clusters configuration section has been removed. Cluster information is now derived from the job archive. apiAllowedIPsis now optional: If not specified, defaults to not restricted.
Architecture changes
- MySQL/MariaDB support removed: Only SQLite is now supported as the database backend.
- Web framework replaced: Migrated from
gorilla/muxtochias the HTTP router. A proper 404 handler is now in place. - MetricStore moved: The
metricstorepackage has been moved frominternal/topkg/as it is now part of the public API. minRunningForfilter removed: This undocumented filter has been removed from the API and frontend. A new Short jobs quick-filter button replaces it.
Major new features
- NATS API Integration: Subscribe to real-time job start/stop events and node
state changes via NATS. NATS subjects are configurable via
api-subjects. - Public Dashboard: New public-facing dashboard route at
/publicfor external users. - Enhanced Node Management: New node state tracking table with timestamp tracking, filtering, and configurable retention/archiving to Parquet format.
- Health Monitoring: New dedicated Health tab in the status details view showing per-node metric health across the cluster. Supports querying external cc-metric-store (CCMS) health status via the API.
- Web-based Log Viewer: Inspect backend log output directly from the browser via the admin interface without requiring shell access.
- Job Tagging System: Automatic detection of applications (MATLAB, GROMACS, etc.) and pathological job classification. Taggers can be triggered on-demand from the admin web interface.
- Parquet Archive Format: New Parquet file format for job archiving with columnar storage and efficient zstd compression. Full S3 and SQLite blob backends are also supported.
- Unified Archive Retention: Job archive retention supports both JSON and Parquet as target formats under a single consistent policy configuration.
What you need to do
- Update
config.json: Rename all configuration attributes tokebab-case(e.g.,apiAllowedIPs→api-allowed-ips). See the configuration reference for the full list of options. - Review cluster configuration: Cluster information is now derived from the
job archive. Remove the
clusterssection fromconfig.jsonand ensure yourcluster.jsonfiles in the job archive are up to date. - Migrate your job database to version 10 (see Database migration).
- Migrate your job archive to version 3 (see Job Archive migration).
- If using NATS, configure the new
natsandapi-subjectssections. - If using archive retention, configure the
target-formatoption to choose betweenjson(default) andparquetoutput formats. - Consider enabling nodestate retention if you track node states over time.
Configuration changes
GitHub Repository with complete configuration examples. All configuration options are checked against a JSON schema.
New configuration options
{
  "main": {
    "enable-job-taggers": true,
    "resampling": {
      "minimum-points": 600,
      "trigger": 180,
      "resolutions": [240, 60]
    },
    "api-subjects": {
      "subject-job-event": "cc.job.event",
      "subject-node-state": "cc.node.state"
    }
  },
  "nats": {
    "address": "nats://0.0.0.0:4222",
    "username": "root",
    "password": "root"
  },
  "cron": {
    "commit-job-worker": "1m",
    "duration-worker": "5m",
    "footprint-worker": "10m"
  },
  "metric-store": {
    "cleanup": {
      "mode": "archive",
      "interval": "48h",
      "directory": "./var/archive"
    }
  },
  "archive": {
    "retention": {
      "policy": "delete",
      "age": "6months",
      "target-format": "parquet"
    }
  },
  "nodestate": {
    "retention": {
      "policy": "archive",
      "age": "30d",
      "archive-path": "./var/nodestate-archive"
    }
  }
}
Transfer cc-metric-store checkpoints
We are currently offering the option to use the metric-store integrated in
cc-backend. Meaning both cc-backend and cc-metric-store share same configuration
as well as they run on the same server. The checkpoints in an internal
cc-metric-store reside in the var directory of cc-backend. If you choose to use
cc-metric-store-internal as your metric store, then you can do the following to
bring your old checkpoints from your previous external cc-metric-store
installation:
Look out for “checkpoints” key in your CCMS and CCB config.json.
"checkpoints": {
  "directory": "./var/checkpoints",
  "restore": "48h"
},
Either you can move the checkpoints manually or you can use this script for moving the checkpoints.
#!/bin/bash

# The path to your "directory" configured in CCMS and CCB config.json
# replace the path as shown with the dummy paths.
CCMS_CHECKPOINTS_DIR="/home/dummy/cc-metric-store/var/checkpoints"
CCB_CHECKPOINTS_DIR="/home/dummy/cc-backend/var/checkpoints"

# Check if the source directory actually exists
if [ -d "$CCMS_DIR" ]; then
    if [ ! -d "$CCB_CHECKPOINTS_DIR" ]; then
        mkdir "$CCB_CHECKPOINTS_DIR"
    fi

    mv -f $CCMS_CHECKPOINTS_DIR $CCB_CHECKPOINTS_DIR
    echo "Success: 'checkpoints' moved from $CCMS_CHECKPOINTS_DIR to $CCB_DIR"
else
    echo "Error: Directory '$CCMS_CHECKPOINTS_DIR' does not exist."
fi
Known issues
- The new dynamic memory management is not bullet proof yet across restarts. We will fix that in a subsequent patch release.
- Currently energy footprint metrics of type energy are ignored for calculating total energy.
- With energy footprint metrics of type power the unit is ignored and it is assumed the metric has the unit Watt.
3 - Getting Started
The central component of ClusterCockpit is the web- and api backend
cc-backend. We provide a demo setup that allows you to get an impression of
the web interface. If you just want to try the demo and you have a Linux OS you
can do so using the cc-backend release binary.
You find detailed instructions on how to setup the demo with the release binary here
If you have a different OS or want to build cc-backend yourself follow the
instructions below.
Prerequisites
To build cc-backend you need:
- A go compiler, version 1.25 or newer. Most recent os environments should have a package with a recent enough version. On MacOS we recommend to use Homebrew to install on.
- A node.js environment including the
npmpackage manager. - A git revision control client.
- For the demo shell script you need
wgetto download the example job archive
Try it out
All ClusterCockpit components are available within the GitHub ClusterCockpit project.
Clone cc-backend and change directory into the repository:
git clone https://github.com/ClusterCockpit/cc-backend.git && cd cc-backend
Note
The startDemo script will download a tar file with 38MB (223MB on disk)!Execute the demo start script:
./startDemo.sh
What follows is output from building cc-backend and downloading the job-archive
HTTP server listening at 127.0.0.1:8080...
Open a web browser and access http://localhost:8080.
You should see the ClusterCockpit login page:
Enter demo for the Username and demo for the Password and press the Submit
button. After that the ClusterCockpit index page should be displayed:
The demo user has the admin role and therefore can see all views.
Note
Because the demo only loads data from the job archive some views as the status and systems view do not work!For details about the features of the web interface have a look at the user guide.
Installation
We provide an installation manual to guide you how to plan and configure a production ClusterCockpit deployment. If you are a computing center and face problems do not hesitate to ask for help in our communication channels.
3.1 - Demo with release binary
The demo setup with the release binary only works with a Linux system running on a x86-64 processor.
Grab the release binary at GitHub. The following description assumes you perform all tasks from your home folder. Extract the tar archive:
tar xzf cc-backend_Linux_x86_64.tar.gz
Create an empty folder and copy the binary cc-backend from the extracted archive folder to this folder:
mkdir ./demo
cp cc-backend ./demo
Change to the demo folder and run the following command to setup the required var
directory, initialize the sqlite database, config.json and .env files:
./cc-backend -init
Open config.json in an editor of your choice to edit the existing clusters
name and add a second cluster. Name the clusters fritz and alex. The file
should look as below afterwards:
| |
Download the demo job archive:
wget https://hpc-mover.rrze.uni-erlangen.de/HPC-Data/0x7b58aefb/eig7ahyo6fo2bais0ephuf2aitohv1ai/job-archive-demo.tar
Extract the job archive:
tar xf job-archive-demo.tar
Initialize the database using the data from the job archive and create the demo user:
./cc-backend -init-db -add-user demo:admin:demo -loglevel info
Start the web server:
./cc-backend -server -dev -loglevel info
Open a web browser and access http://localhost:8080.
You should see the ClusterCockpit login page: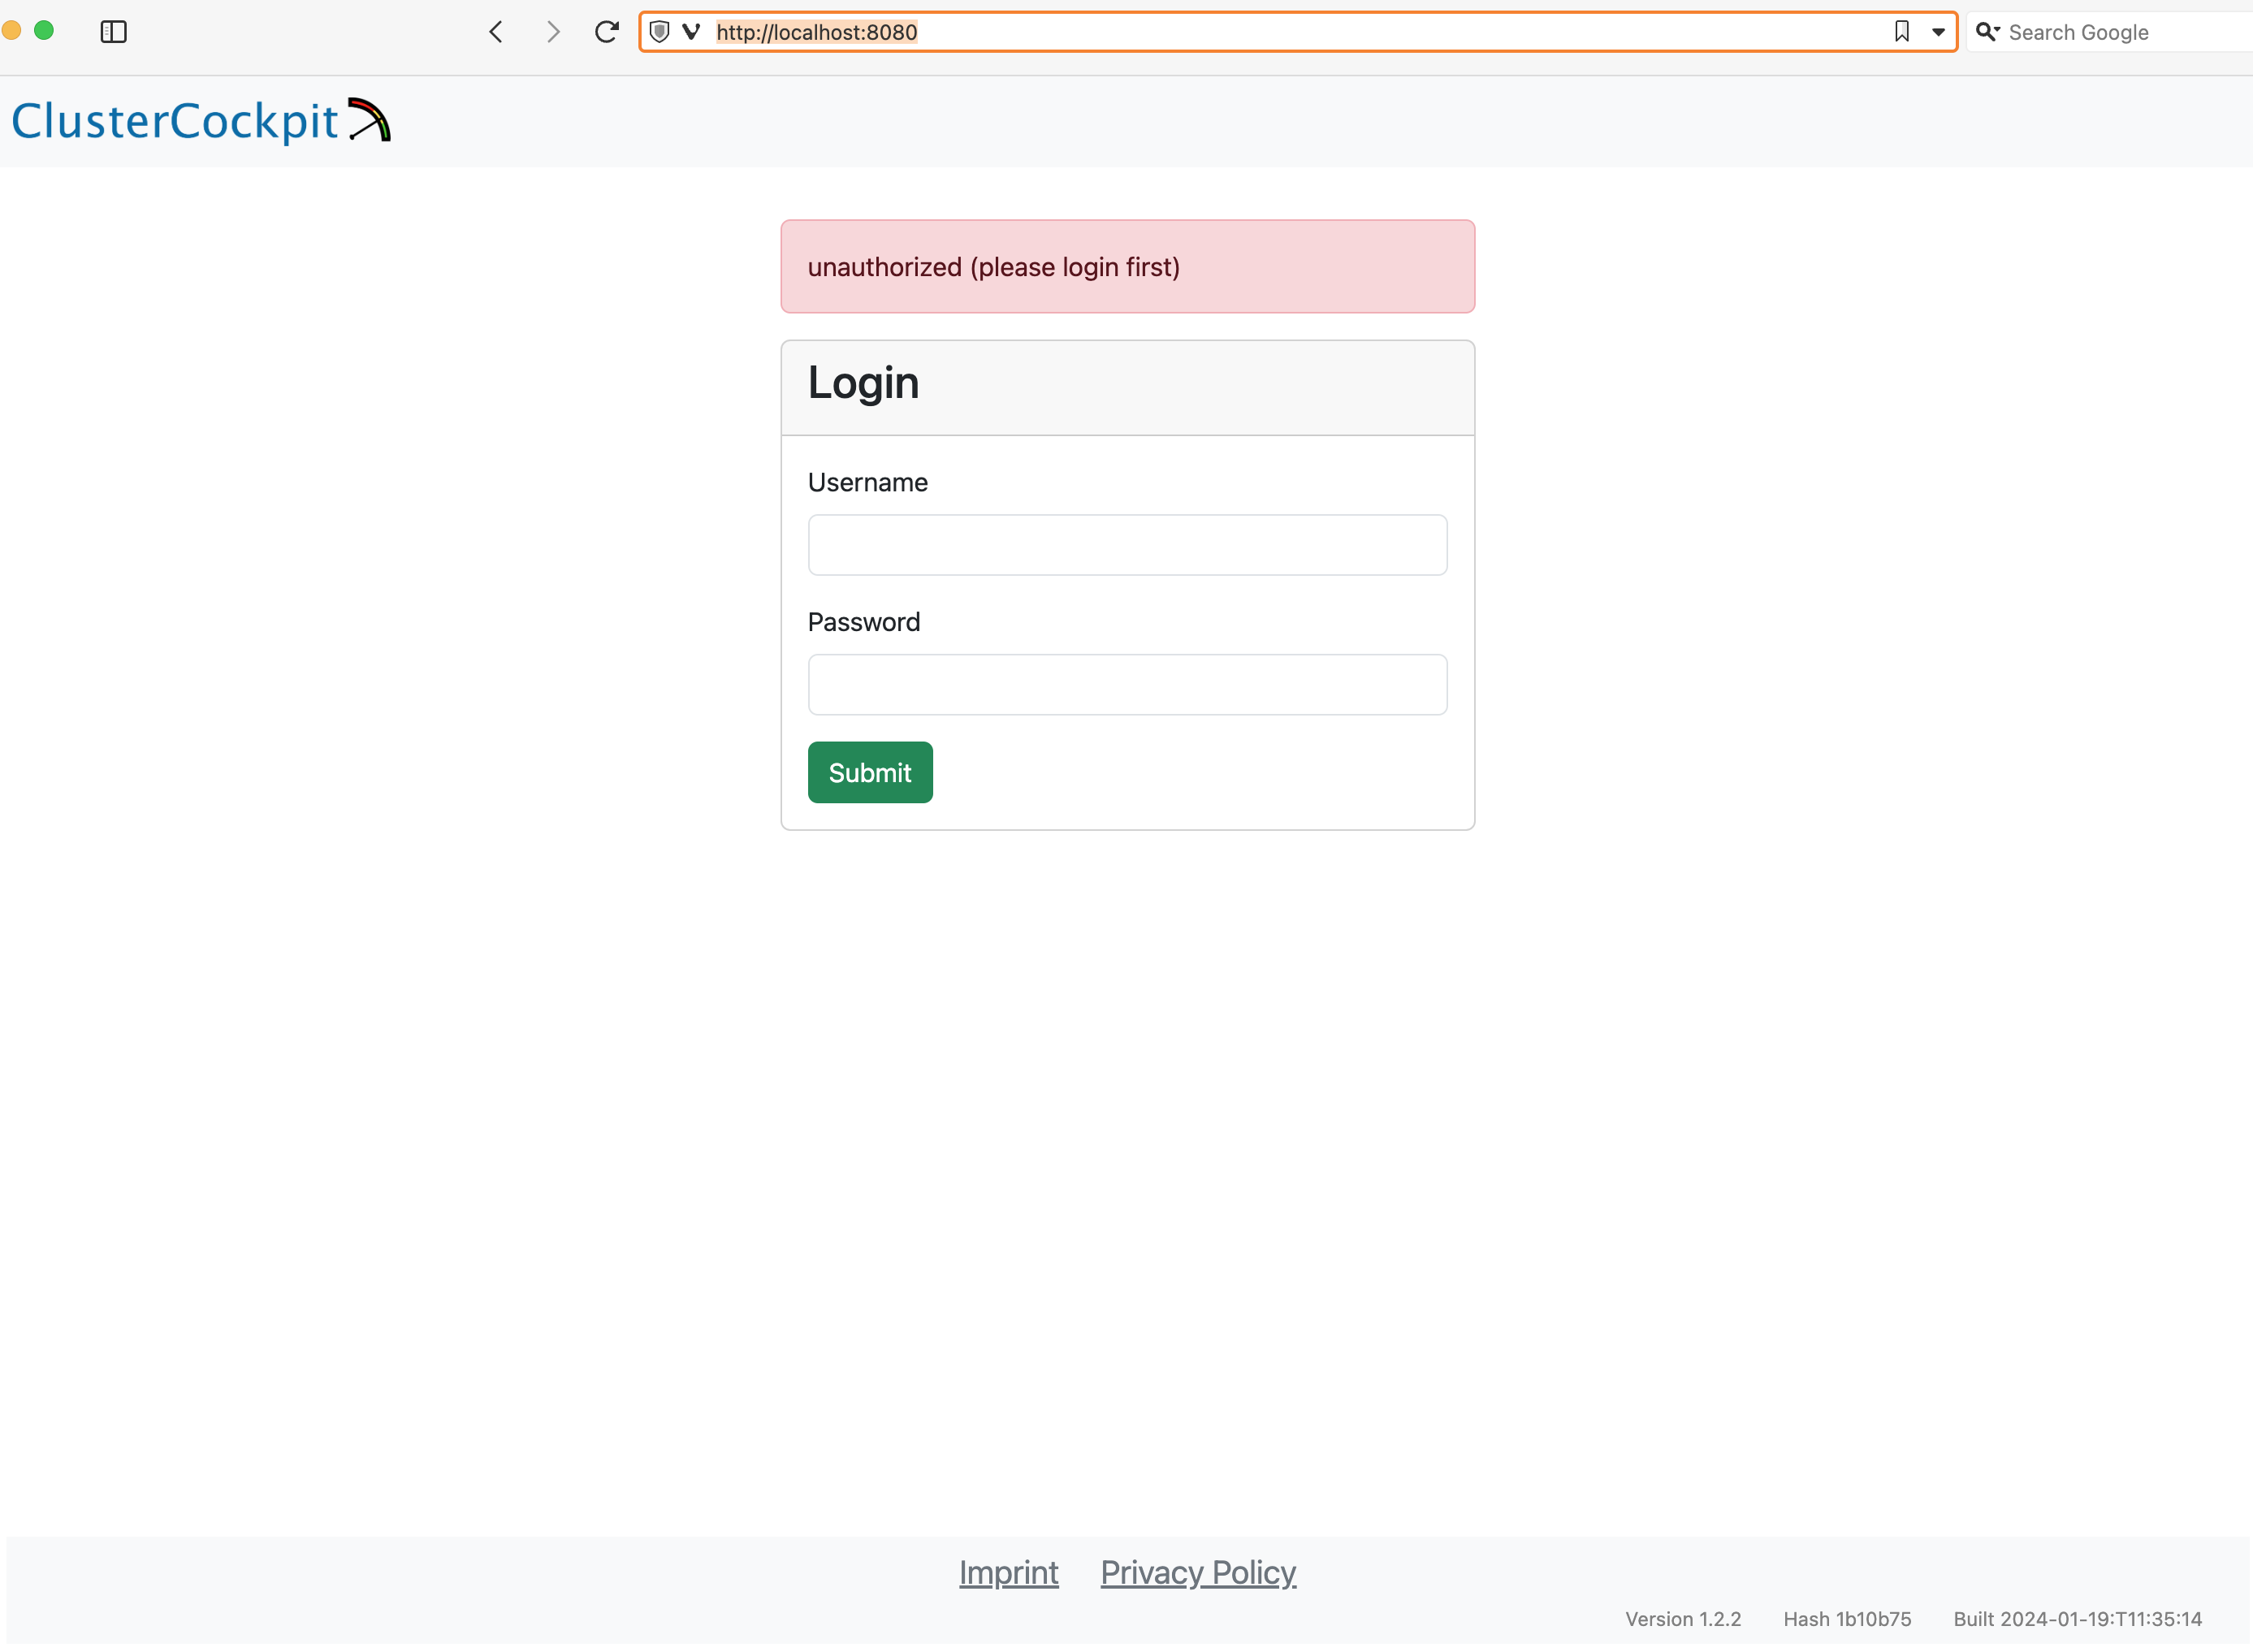
Enter demo for the Username and demo for the Password and press the Submit button. After that the ClusterCockpit index page should be displayed: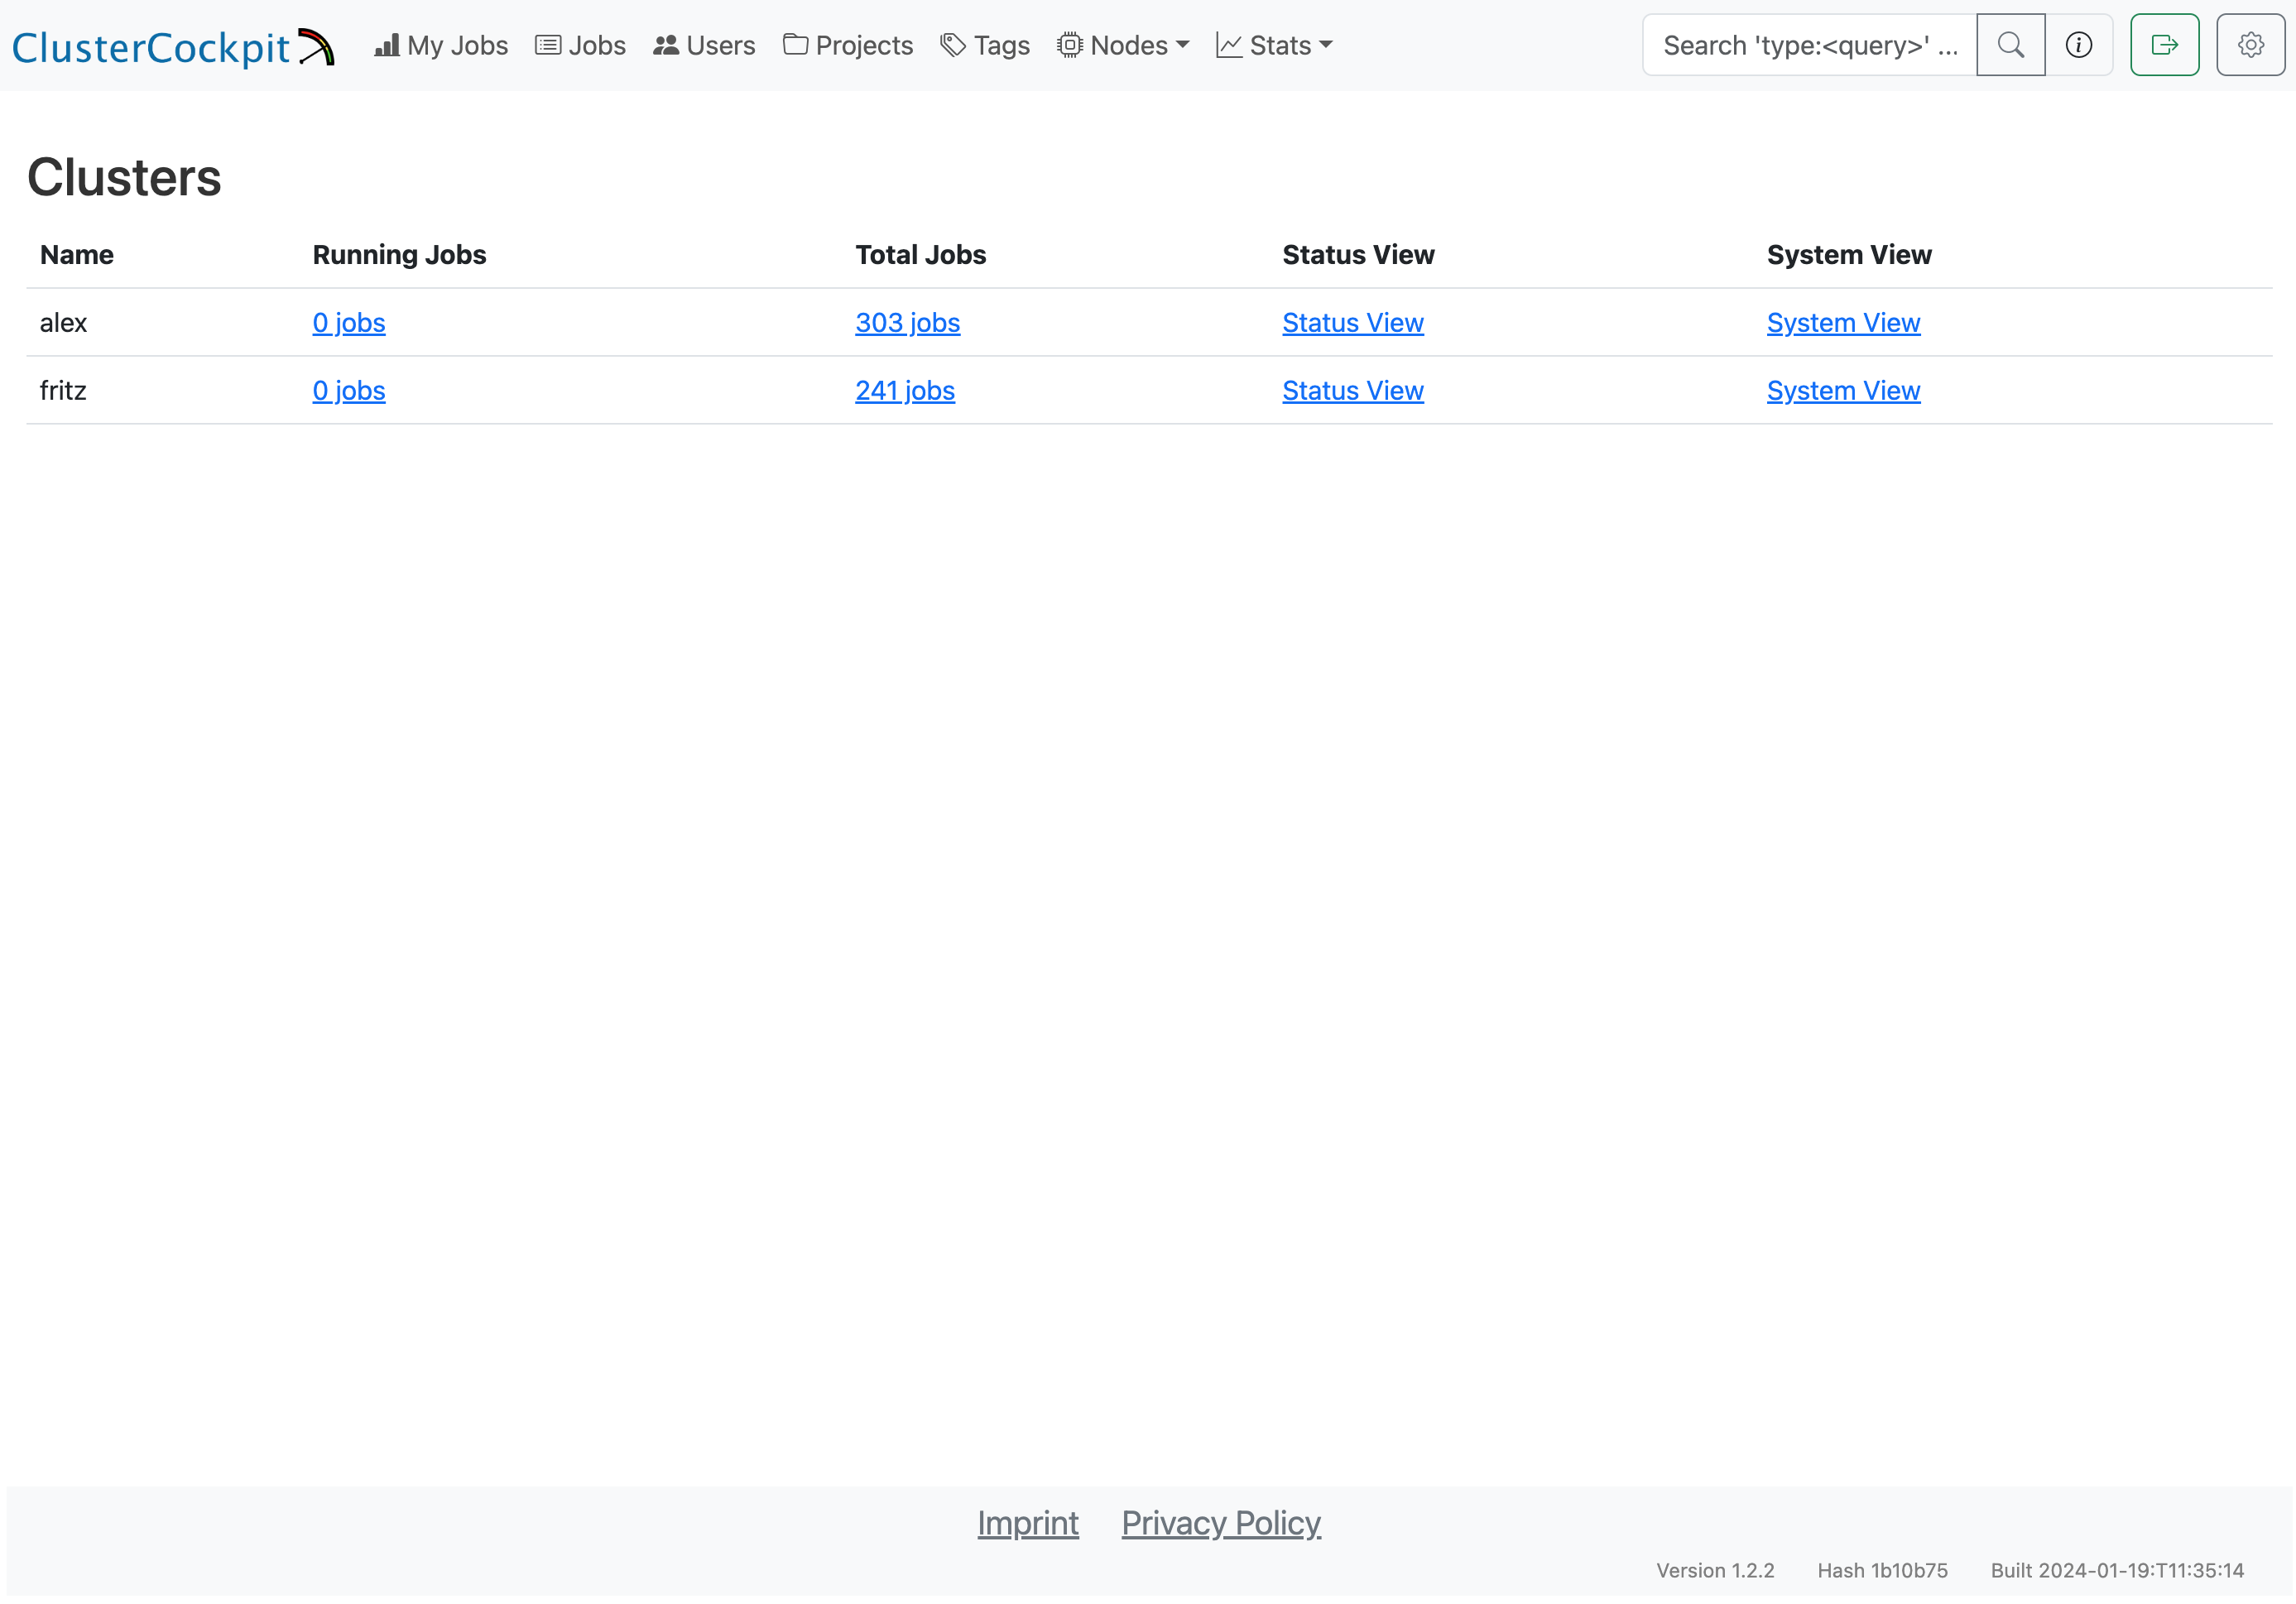
The demo user has the admin role and therefore can see all views.
Note
Because the demo only loads data from the job archive some views as the status and systems view do not work!For details about the features of the web interface have a look at the user guide.
4 - Tutorials
4.1 - Plan overall ClusterCockpit architecture
Introduction
When deploying ClusterCockpit in production, two key architectural decisions need to be made:
- Transport mechanism: How metrics flow from collectors to the metric store (REST API vs NATS)
- Metric store deployment: Where the metric store runs (internal to cc-backend vs external standalone)
This guide helps you understand the trade-offs to make informed decisions based on your cluster size, administrative capabilities, and requirements. You may also use a mix of above options.
Transport: REST API vs NATS
The cc-metric-collector can send metrics to cc-metric-store using either direct HTTP REST API calls or via NATS messaging.
REST API Transport
With REST transport, each collector node sends HTTP POST requests directly to the metric store endpoint.
┌─────────────┐     HTTP POST      ┌──────────────────┐
│  Collector  │ ─────────────────► │  cc-metric-store │
│   (Node 1)  │                    │                  │
└─────────────┘                    │                  │
┌─────────────┐     HTTP POST      │                  │
│  Collector  │ ─────────────────► │                  │
│   (Node 2)  │                    └──────────────────┘
└─────────────┘
      ...
Advantages:
- Simple setup with no additional infrastructure
- Direct point-to-point communication
- Easy to debug and monitor
- Works well for smaller clusters (< 500 nodes)
Disadvantages:
- Each collector needs direct network access to metric store
- No buffering: if metric store is unavailable, metrics are lost
- Scales linearly with node count (many concurrent connections)
- Higher load on metric store during burst scenarios
NATS Transport
With NATS, collectors publish metrics to a NATS server, and the metric store subscribes to receive them.
┌─────────────┐                    ┌─────────────┐
│  Collector  │ ──► publish ──►    │             │
│   (Node 1)  │                    │             │
└─────────────┘                    │    NATS     │     subscribe     ┌──────────────────┐
┌─────────────┐                    │   Server    │ ◄───────────────► │  cc-metric-store │
│  Collector  │ ──► publish ──►    │             │                   └──────────────────┘
│   (Node 2)  │                    │             │
└─────────────┘                    └─────────────┘
      ...
Advantages:
- Decoupled architecture: collectors and metric store are independent
- Built-in buffering and message persistence
- Better scalability for large clusters (1000+ nodes)
- Supports multiple subscribers (e.g., external metric store for redundancy)
- Collectors continue working even if metric store is temporarily down
- Lower connection overhead (single connection per collector to NATS)
- Integrated key management via NKeys (Ed25519-based authentication):
- No need to generate and distribute JWT tokens to each collector
- Centralized credential management in NATS server configuration
- Support for accounts with fine-grained publish/subscribe permissions
- Credential revocation without redeploying collectors
- Simpler key rotation compared to JWT token redistribution
Disadvantages:
- Additional infrastructure component to deploy and maintain
- More complex initial setup and configuration
- Additional point of failure (NATS server)
- Requires NATS expertise for troubleshooting
Recommendation
| Cluster Size | Recommended Transport |
|---|---|
| < 200 nodes | REST API |
| 200-500 nodes | Either (based on preference) |
| > 500 nodes | NATS |
For large clusters or environments requiring high availability, NATS provides better resilience and scalability. For smaller deployments or when minimizing complexity is important, REST API is sufficient.
Metric Store: Internal vs External
The cc-metric-store storage engine can run either integrated within cc-backend (internal) or as a separate standalone service (external).
Internal Metric Store
The metric store runs as part of the cc-backend process, sharing the same configuration and lifecycle.
┌────────────────────────────────────────┐
│              cc-backend                │
│  ┌──────────────┐  ┌────────────────┐  │
│  │   Web UI &   │  │  metric-store  │  │
│  │   GraphQL    │  │    (internal)  │  │
│  └──────────────┘  └────────────────┘  │
└────────────────────────────────────────┘
         │                    ▲
         ▼                    │
    ┌─────────┐          ┌─────────┐
    │ Browser │          │Collector│
    └─────────┘          └─────────┘
Advantages:
- Single process to deploy and manage
- Unified configuration
- Simplified networking (metrics received on same endpoint)
- Lower resource overhead
- Easier initial setup
Disadvantages:
- Metric store restart requires cc-backend restart and the other way around
- A cc-backend restart can take more then a minute since the metric store checkpoints have to be loaded on startup
- Resource contention between web serving and metric ingestion
- No horizontal scaling of metric ingestion
- Single point of failure for entire system
External Metric Store
The metric store runs as a separate process, communicating with cc-backend via its REST API.
┌──────────────────┐         ┌──────────────────┐
│    cc-backend    │ ◄─────► │  cc-metric-store │
│   (Web UI/API)   │  query  │    (external)    │
└──────────────────┘         └──────────────────┘
         │                            ▲
         ▼                            │
    ┌─────────┐                  ┌─────────┐
    │ Browser │                  │Collector│
    └─────────┘                  └─────────┘
Advantages:
- Independent scaling and resource allocation
- Can restart metric store without affecting web interface and the other way around
- Enables redundancy with multiple metric store instances
- Better isolation for security and resource management
- Can run on dedicated hardware optimized for in-memory workloads
Disadvantages:
- Two services to deploy and manage
- Separate configuration files
- Additional network communication between components
- More complex setup and monitoring
Recommendation
| Scenario | Recommended Deployment |
|---|---|
| Development/Testing | Internal |
| Small production (< 200 nodes) | Internal |
| Medium production (200-1000 nodes) | Either |
| Large production (> 1000 nodes) | External |
| Resource-constrained head node | External (on dedicated host) |
Security Considerations
Network Exposure
| Component | REST Transport | NATS Transport |
|---|---|---|
| Metric Store | Exposed to all collector nodes | Only exposed to NATS server |
| NATS Server | N/A | Exposed to all collectors and metric stores |
| cc-backend | Exposed to users | Exposed to users |
With NATS, the metric store can be isolated from the cluster network, reducing attack surface. The NATS server becomes the single point of ingress for metrics. Another option to isolate the web backend from the cluster network is to setup cc-metric-collector proxies.
Authentication
- REST API: Uses JWT tokens (Ed25519 signed). Each collector needs a valid token configured and distributed to it.
- NATS: Supports multiple authentication methods:
- Username/password (simple, suitable for smaller deployments)
- NKeys (Ed25519 key pairs managed centrally in NATS server)
- Credential files (
.creds) for decentralized authentication - Accounts for multi-tenancy with isolated namespaces
NKeys Advantage: With NATS NKeys, authentication keys are managed in the NATS server configuration rather than distributed to each collector. This simplifies credential management significantly:
- Add/remove collectors by editing NATS server config
- Revoke access instantly without touching collector nodes
- No JWT token expiration to manage
- Keys can be scoped to specific subjects (publish-only for collectors)
For both transports, ensure:
- Keys are properly generated and securely stored
- TLS is enabled for production deployments
- Network segmentation isolates monitoring traffic
Privilege Separation
Both cc-backend and the external cc-metric-store support dropping
privileges after binding to privileged ports (via user and group
configuration). This limits the impact of potential vulnerabilities.
Performance Considerations
Memory Usage
The metric store keeps data in memory based on retention-in-memory. Memory
usage scales with:
- Number of nodes
- Number of metrics per node
- Number of hardware scopes (cores, sockets, accelerators)
- Retention duration
- Metric frequency
For a 1000-node cluster with 20 metrics at 60-second intervals and 48-hour retention, expect approximately 10-20 GB of memory usage. For larger setups and many core level metrics this can increase up to 100GB, which must fit into main memory.
CPU Usage
- Internal: Competes with cc-backend web serving
- External: Dedicated resources for metric processing
For clusters with high query load (many users viewing job details), external deployment prevents metric ingestion from impacting user experience.
Disk I/O
Checkpoints are written periodically. For large deployments:
- Use fast storage (SSD) for checkpoint directory
- Consider separate disks for checkpoints and archives
- Monitor disk space for archive growth
- ClusterCockpit supports to store archives on an external S3 compatible object store
Example Configurations
Small Cluster (Internal + REST)
Single cc-backend with internal metric store, collectors using REST:
// cc-backend config
{
  "metric-store": {
    "retention-in-memory": "48h",
    "memory-cap": 100,
    "checkpoints": {
      "directory": "./var/checkpoints"
    }
  }
}
Large Cluster (External + NATS)
Separate cc-metric-store with NATS transport:
// cc-metric-store config
{
  "main": {
    "addr": "0.0.0.0:8080",
    "jwt-public-key": "..."
  },
  "nats": {
    "address": "nats://nats-server:4222",
    "username": "ccms",
    "password": "..."
  },
  "metric-store": {
    "retention-in-memory": "48h",
    "memory-cap": 80,
    "checkpoints": {
      "directory": "/data/checkpoints"
    },
    "cleanup": {
      "mode": "archive",
      "directory": "/data/archive"
    },
    "nats-subscriptions": [
      {
        "subscribe-to": "hpc-metrics",
        "cluster-tag": "mycluster"
      }
    ]
  }
}
Decision Checklist
Use this checklist to guide your architecture decision:
- Cluster size: How many nodes need monitoring?
- Availability requirements: Is downtime acceptable?
- Administrative capacity: Can you manage additional services?
- Network topology: Can collectors reach the metric store directly?
- Resource constraints: Is the head node resource-limited?
- Security requirements: Do you need network isolation?
- Growth plans: Will the cluster expand significantly?
For most new deployments, starting with internal metric store and REST transport is recommended. You can migrate to external deployment and/or NATS later as needs evolve.
4.2 - ClusterCockpit installation manual
Introduction
ClusterCockpit requires the following components:
- A node agent running on all compute nodes that measures required metrics and
forwards all data to a time series metrics database. ClusterCockpit provides
its own node agent
cc-metric-collector. This is the recommended setup, but ClusterCockpit can also be integrated with other node agents, e.g.collectd,prometheusortelegraf. In this case you have to use it with the accompanying time series database and ensure the metric data is send or forwarded tocc-backend. - The api and web interface backend
cc-backend. Only one instance ofcc-backendis required. This will provide the HTTP server at the desired monitoring URL for serving the web interface. It also integrates an in-memory metric store. - A SQL database. The only supported option is to use the builtin sqlite database for ClusterCockpit. It is recommended to setup LiteStream as a service which performs a continuous replication of the sqlite database to multiple storage backends.
- (Optional) Metric store: One or more
cc-metric-storeinstances. Advantages for using an external cc-metric-store are:- Independent scaling and resource allocation
- Can restart metric store without affecting web interface and the other way around
- Enables redundancy with multiple metric store instances
- Better isolation for security and resource management
- Can run on dedicated hardware optimized for in-memory workloads
- (Optional) NATS message broker: Apart from REST APIs ClusterCockpit also
supports NATS as a way to connect components. Using NATS brings a number of
advantages:
- More flexible deployment and testing. Instances can have different URLs or IP addresses. Test instances are easy to deploy in parallel without a need to touch the configuration.
- NATS comes with a builtin sophisticated token key management. This also enables to restrict authorization to specific subjects.
- NATS may provide a larger message throughput compared to REST over HTTP.
- Upcoming ClusterCockpit components as the Energy Manager require NATS.
- A batch job scheduler adapter that provides the job meta information to
cc-backend. This is done by using the provided REST or NATS API for starting and stopping jobs. Currently available adapters:- Slurm: Golang based solution
(cc-slurm-adapter) maintained
by NHR@FAU. This is the recommended option in case you use Slurm. All
functionality in
cc-backendis supported. - Slurm: Python based solution (cc-slurm-sync) maintained by PC2 Paderborn
- HTCondor: cc-condor-sync maintained by Saarland University
- Slurm: Golang based solution
(cc-slurm-adapter) maintained
by NHR@FAU. This is the recommended option in case you use Slurm. All
functionality in
Server Hardware
cc-backend is threaded and therefore profits from multiple cores.
Enough memory is required to hold the metric data cache. For most setups 128GB
should be enough. You can set an upper limit for the memory capacity used by the
internal metric in-memory cache. How much memory is required depends apart from
the resource count also on the frequency of the timeseries data. Starting with
cc-backend v1.5.0 you do not need a safety margin anymore for memory
retention.
It is possible to run it in a virtual machine. For best
performance the ./var folder of cc-backend which contains the sqlite
database file and the file based job archive should be located on a fast storage
device, ideally a NVMe SSD. The sqlite database file and the job archive will
grow over time (if you are not removing old jobs using a retention policy).
Our setup covering multiple clusters over 5 years takes 75GB for the sqlite database
and around 1.4TB for the job archive. In case you have very high job counts, we
recommend to use a retention policy to keep the database and the job archive at
a manageable size. In case you archive old jobs the database can be easily
restored using cc-backend.
It is recommended to run cc-backend as a systemd service. Example systemd unit
files are available in the ClusterCockpit component repositories and in the
cc-examples repository.
Planning and initial configuration
We recommended the following order for planning and configuring a ClusterCockpit installation:
- Decide on overall setup: Initially you have to decide on some fundamental design options about how the components communicate with each other and how the data flows from the compute nodes to the backend.
- Setup your metric list: With two exceptions
you are in general free which metrics you want choose. Those exceptions are:
mem_bwfor main memory bandwidth andflops_anyfor flop throughput (double precision flops are upscaled to single precision rates). The metric list is an integral component for the configuration of all ClusterCockpit components. - Planning of deployment
- (Optional) Configure and deploy
cc-metric-store - Configure and deploy
cc-metric-collector - Configure and deploy
cc-backend - Configure and deploy
cc-slurm-adapteror another job scheduler adapter of your choice
You can find complete example production configurations in the cc-examples repository.
Common problems
Up front here is a list with common issues people are facing when installing ClusterCockpit for the first time.
Inconsistent metric names across components
At the moment you need to configure the metric list in every component
separately. In cc-metric-collector the metrics that are send to the
cc-backend are determined by the collector configuration and possible
renaming in the router configuration.
In cc-backend for every cluster you need to create a cluster.json
configuration in the job-archive. There you setup which metrics are shown in the
web-frontend including many additional properties for the metrics. For running
jobs cc-backend will query the internal metric-store for exactly those
metric names and if there is no match there will be an error.
We provide a JSON schema based specification as part of the job meta and metric
schema. This specification recommends a minimal set of metrics and we suggest to
use the metric names provided there. While it is up to you if you want to adhere
to the metric names suggested in the schema, there are two exceptions: mem_bw
(main memory bandwidth) and flops_any (total flop rate with DP flops scaled to
SP flops) are required for the roofline plots to work.
Inconsistent device naming between cc-metric-collector and batch job scheduler adapter
The batch job scheduler adapter (e.g. cc-slurm-adapter) provides a list of
resources that are used by the job. cc-backend will query the internal metric-store
with exactly those resource ids for getting all metrics for a job.
As a consequence if cc-metric-collector uses another systematic the metrics
will not be found.
If you have GPU accelerators cc-slurm-adapter should use the PCI-E device
addresses as ids. The option gpuPciAddrs for the nvidia and
rocm-smi collectors in the collector configuration must be configured.
To validate and debug problems you can use the cc-backend or cc-metric-store
debug endpoint:
curl -H "Authorization: Bearer $JWT" -D - "http://localhost:8080/api/debug"
This will return the current state of cc-metric-store. You can search for a
hostname and scroll there for all topology leaf nodes that are available.
Missing nodes in subcluster node lists
ClusterCockpit supports multiple subclusters as part of a cluster. A subcluster
in this context is a homogeneous hardware partition with a dedicated metric
and device configuration. cc-backend dynamically matches the nodes a job runs
on to a subcluster node list to figure out on which subcluster a job is running.
If nodes are missing in a subcluster node list this fails and the metric list
used may be wrong.
4.3 - Decide on metric list
Introduction
To decide on a sensible and meaningful set of metrics is deciding factor for how useful the monitoring will be. As part of a collaborative project several academic HPC centers came up with a minimal set of metrics including their naming. To use a consistent naming is crucial for establishing what metrics mean and we urge you to adhere to the metric names suggested there. You can find this list as part of the ClusterCockpit job data structure JSON schemas.
ClusterCockpit supports multiple clusters within one instance of cc-backend.
You have to create separate metric lists for each of them. In cc-backend the
metric lists are provided as part of the cluster configuration. Every cluster is
configured as part of the
job archive using one
cluster.json file per cluster.
This how-to describes
in-detail how to create a cluster.json file.
Required Metrics
Flop throughput rate: flops_any
Memory bandwidth: mem_bw
Memory capacity used: mem_used
Requested cpu core utilization: cpu_load
Total fast network bandwidth: net_bw
Total file IO bandwidth: file_bw
Recommended CPU Metrics
Instructions throughput in cycles: ipc
User active CPU core utilization: cpu_user
Double precision flop throughput rate: flops_dp
Single precision flop throughput rate: flops_sp
Average core frequency: clock
CPU power consumption: rapl_power
Recommended GPU Metrics
GPU utilization: acc_used
GPU memory capacity used: acc_mem_used
GPU power consumption: acc_power
Recommended node level metrics
Ethernet read bandwidth: eth_read_bw
Ethernet write bandwidth: eth_write_bw
Fast network read bandwidth: ic_read_bw
Fast network write bandwidth: ic_write_bw
File system metrics
Warning
A file system metric tree is currently not yet supported incc-backendIn the schema a tree of file system metrics is suggested. This allows to provide a similar set of metrics for different file systems used in a cluster. The file system type names suggested are:
- nfs
- lustre
- gpfs
- nvme
- ssd
- hdd
- beegfs
File system read bandwidth: read_bw
File system write bandwidth: write_bw
File system read requests: read_req
File system write requests: write_req
File system inodes used: inodes
File system open and close: accesses
File system file syncs: fsync
File system file creates: create
File system file open: open
File system file close: close
File system file seeks: seek
4.4 - Deployment
Deployment
Why we do not provide a docker container
The ClusterCockpit web backend binary has no external dependencies, everything is included in the binary. The external assets, SQL database and job archive, would also be external in a docker setup. The only advantage of a docker setup would be that the initial configuration is automated. But this only needs to be done one time. We therefore think that setting up docker, securing and maintaining it is not worth the effort.It is recommended to install all ClusterCockpit components in a common
directory, e.g. /opt/monitoring, var/monitoring or var/clustercockpit. In
the following we use /opt/monitoring.
A Systemd service runs on the central monitoring server:
- clustercockpit : Binary cc-backend in
/opt/monitoring/cc-backend. - (Optional with external metric-store) cc-metric-store : Binary cc-metric-store in
/opt/monitoring/cc-metric-store.
ClusterCockpit is deployed as a single binary that embeds all static assets.
We recommend keeping all cc-backend binary versions in a folder archive and
linking the currently active one from the cc-backend root.
This allows for easy roll-back in case something doesn’t work.
Please Note
cc-backend is started with root rights to open the privileged ports (80 and
443). It is recommended to set the configuration options user and group, in
which case cc-backend will drop root permissions once the ports are taken.
You have to take care, that the ownership of the ./var folder and
its contents are set accordingly.
You also can run cc-backend behind a reverse proxy. In this case it can be
started with an unprivileged user and the reverse proxy takes care of TLS
encryption. This also enables to automatically show a maintenance page in case
ClusterCockpit is not reachable.Workflow to deploy new version
This example assumes you are deploying ClusterCockpit for the first time or the DB and job archive versions did not change between versions.
- Stop systemd service:
sudo systemctl stop clustercockpit.service
- Backup the sqlite DB file! This is as simple as to copy it. You can also use a continuous replication service as e.g. litestream.
- Copy new
cc-backendbinary to/opt/monitoring/cc-backend/archive(Tip: Use a date tag likeYYYYMMDD-cc-backend). Here is an example:
cp ~/cc-backend /opt/monitoring/cc-backend/archive/20231124-cc-backend
- Link from
cc-backendroot to current version
ln -s /opt/monitoring/cc-backend/archive/20231124-cc-backend /opt/monitoring/cc-backend/cc-backend
- Start systemd service:
sudo systemctl start clustercockpit.service
- Check if everything is ok:
sudo systemctl status clustercockpit.service
- Check log for errors:
sudo journalctl -u clustercockpit.service
- Check the ClusterCockpit web frontend and your Slurm adapters if anything is broken!
4.5 - Setup of cc-metric-store
Note
The standalone cc-metric-store shares its core storage engine with cc-backend. Its role is for distributed setups and redundancy.Introduction
The cc-metric-store provides an in-memory metric time-series database. It is
configured via a JSON configuration file (config.json). Metrics are received
via messages using the ClusterCockpit ccMessage protocol.
It can receive messages via an HTTP REST API or by subscribing to a NATS subject.
Requesting data is possible via an HTTP REST API.
Configuration
For a complete list of configuration options see
here.
The configuration is organized into four main sections: main, metrics,
nats, and metric-store.
Minimal example of a configuration file:
{
  "main": {
    "addr": "0.0.0.0:8082",
    "jwt-public-key": "kzfYrYy+TzpanWZHJ5qSdMj5uKUWgq74BWhQG6copP0="
  },
  "metrics": {
    "clock": {
      "frequency": 60,
      "aggregation": "avg"
    },
    "mem_bw": {
      "frequency": 60,
      "aggregation": "sum"
    },
    "flops_any": {
      "frequency": 60,
      "aggregation": "sum"
    },
    "flops_dp": {
      "frequency": 60,
      "aggregation": "sum"
    },
    "flops_sp": {
      "frequency": 60,
      "aggregation": "sum"
    },
    "mem_used": {
      "frequency": 60,
      "aggregation": null
    }
  },
  "metric-store": {
    "retention-in-memory": "48h",
    "memory-cap": 100,
    "checkpoints": {
      "file-format": "wal",
      "directory": "./var/checkpoints"
    },
    "cleanup": {
      "mode": "archive",
      "directory": "./var/archive"
    }
  }
}
Main Section
The main section specifies the address and port on which the server should
listen (addr). Optionally, for HTTPS, paths to TLS cert and key files can be
specified via https-cert-file and https-key-file. If using a privileged
port (e.g., 443), you can specify user and group to drop root permissions
after binding. The backend-url option allows connecting to cc-backend for
querying job information. This is required to enable the dynamic memory
retention in cc-metric-store. The REST API uses JWT token based authentication.
The option jwt-public-key provides the ED25519 public key to verify signed
JWT tokens.
Metrics Section
The cc-metric-store will only accept metrics that are specified in its metric
list. The metric names must exactly match! The frequency for the metrics
specifies how incoming values are binned. If multiple values are received in the
same interval older values are overwritten, if no value is received in an
interval there is a gap. cc-metric-store can aggregate metrics across
topological entities, e.g., to compute an aggregate node scope value from core
scope metrics. The aggregation attribute specifies how the aggregate value is
computed. Resource metrics usually require sum, whereas diagnostic metrics
(e.g., clock) require avg. For clock a sum would obviously make no sense.
Metrics that are only available at node scope should set aggregation to null.
Metric-Store Section
The most important configuration option is the retention-in-memory setting. It
specifies for which duration back in time metrics should be provided. This
should be long enough to cover common job durations. The memory-cap option
sets the approximate maximum memory capacity in GB to use. The memory footprint
scales with the number of nodes, the number of native metric scopes (cores,
sockets), the number of metrics, and the memory retention time divided by the
frequency.
The num-workers option controls the number of parallel workers used for
checkpoint and archive I/O. Setting it to 0 (the default) enables automatic
setup, capped at 10.
The cc-metric-store supports checkpoints and cleanup/archiving. Checkpoints
are always performed on shutdown. To not lose data on a crash or other failure,
checkpoints are written at regular intervals configured via
checkpoints.interval (e.g. "12h"). The checkpoints.file-format option
selects the persistence format: "json" (human-readable) or "wal" (binary
Write-Ahead Log, crash-safe, default). See Checkpoint
Formats below. Checkpoints that are not needed anymore can
either be archived or deleted, controlled by the cleanup.mode setting
(archive or delete). The cleanup runs at the interval specified in
cleanup.interval.
Checkpoint Formats
The checkpoints.file-format field controls how in-memory data is persisted to
disk.
"json" — Human-readable JSON snapshots written
periodically. Each snapshot is stored as
<dir>/<cluster>/<host>/<timestamp>.json. Easy to inspect and recover manually,
but larger on disk and slower to write.
"wal" (recommended) — Binary Write-Ahead Log format designed for crash
safety. Two file types are used per host:
current.wal— append-only binary log; every incoming data point is appended immediately. Truncated trailing records from unclean shutdowns are silently skipped on restart.<timestamp>.bin— binary snapshot written at each checkpoint interval, containing the complete metric state. Written atomically via a.tmprename.
On startup the most recent .bin snapshot is loaded, then remaining WAL entries
are replayed on top. The WAL is rotated after each successful snapshot. The
"wal" format will become the only supported option in a future release. If you
are migrating from an older installation using JSON checkpoints, switch to "wal"
after a clean restart.
Parquet Archive
When cleanup.mode is "archive", data that ages out of the in-memory
retention window is written to Apache Parquet
files before being freed, organized as:
<cleanup.directory>/
  <cluster>/
    <timestamp>.parquet
One Parquet file is produced per cluster per cleanup run, consolidating all hosts. Files are compressed with Zstandard and sorted by cluster, hostname, metric, and timestamp for efficient columnar reads.
Authentication
For authentication signed (but unencrypted) JWT tokens are used. Only Ed25519/EdDSA cryptographic key-pairs are supported. A client has to sign the token with its private key, on the server side it is checked if the configured public key matches the private key with which the token was signed, if the token was altered after signing, and if the token has expired. All other token attributes are ignored.
We provide an article on how to generate JWT. The is also a background info article on JWT usage in ClusterCockpit. Tokens are cached in cc-metric-store to minimize overhead.
NATS
As an alternative to HTTP REST cc-metric-store can also receive metrics via
NATS. You find more infos about NATS in this background article.
To enable NATS in cc-metric-store add the nats section for the connection
and nats-subscriptions in the metric-store section:
{
  "nats": {
    "address": "nats://localhost:4222",
    "username": "user",
    "password": "password"
  },
  "metric-store": {
    "nats-subscriptions": [
      {
        "subscribe-to": "hpc-nats",
        "cluster-tag": "fritz"
      }
    ]
  }
}
The nats section configures the NATS server connection with address and
credentials. The nats-subscriptions within metric-store define which
subjects to subscribe to and how to tag incoming metrics with cluster
information in case this is not already done.
4.6 - Setup of cc-metric-collector
Introduction
cc-metric-collector is a node agent for measuring, processing and forwarding
node level metrics. It is currently mostly documented via Markdown documents in
its GitHub repository.
The configuration consists of the following parts:
collectors: Metric sources. There is a large number of collectors available. Important and also most demanding to configure is the likwid collector for measuring hardware performance counter metrics.router: Rename, drop and modify metrics.sinks: Configuration where to send the metrics.receivers: Receive metrics. Useful as a proxy to connect different metric sinks. Can be left empty in most cases.
Build and deploy
Since the cc-metric-collector needs to be installed on every compute node and
requires configuration specific to the node hardware it is demanding to install
and configure. The Makefile supports to generate RPM and DEB packages. There is
also a Systemd service file included which you may take as a blueprint.
More information on deployment is available here.
Collectors
You may want to have a look at our collector configuration
which includes configurations for many different systems, Intel and AMD CPUs and
NVIDIA GPUs. The general recommendation is to first decide on the metrics you
need and then figure out which collectors are required. For hardware performance
counter metrics you may want to have a look at likwid-perfctr
performance groups
for inspiration on how to compute the required derived metrics on your
target processor architecture.
Router
The router enables to rename, drop and modify metrics. Top level configuration attributes (can be usually be left at default):
interval_timestamp: Metrics received within same interval get the same identical time stamp if true. Default is true.num_cache_intervals: Number of intervals that are cached in router. Default is 1. Set to 0 to disable router cache.hostname_tag: Set a host name different that what is returned byhostname.max_forward: Number of metrics read at once from a Golang channel. Default is 50. Option has to be larger than 1. Recommendation: Leave at default!
Below you find the operations that are supported by the message processor.
Rename metrics
To rename metric names add a rename_messages section mapping the old metric
name to the new name.
"process_messages" : {
    "rename_messages" : {
        "load_one" : "cpu_load",
        "net_bytes_in_bw" : "net_bytes_in",
        "net_bytes_out_bw" : "net_bytes_out",
        "net_pkts_in_bw" : "net_pkts_in",
        "net_pkts_out_bw" : "net_pkts_out",
        "ib_recv_bw" : "ib_recv",
        "ib_xmit_bw" : "ib_xmit",
        "lustre_read_bytes_diff" : "lustre_read_bytes",
        "lustre_read_requests_diff" : "lustre_read_requests",
        "lustre_write_bytes_diff" : "lustre_write_bytes",
        "lustre_write_requests_diff" : "lustre_write_requests"
    }
}
Drop metrics
Sometimes collectors provide a lot of metrics that are not needed. To save
data volume metrics can be dropped. Some collectors also support to exclude
metrics at the collector level using the exclude_metrics option.
Note
If you are using thecc-metric-store all metrics that are not configured in
its metric list are also silently dropped."process_messages" : {
"drop_messages" : [
"load_five",
"load_fifteen",
"proc_run",
"proc_total"
]
}
Normalize unit naming
Enforce a consistent naming of units in metrics. This option should always be set to true which is the default. The metric value is not altered!
"process_messages" : {
    "normalize_units": true
}
Change metric unit
The collectors usually do not alter the unit of a metric. To change the unit set
the change_unit_prefix key. The value is automatically scaled correctly,
depending on the old unit prefix.
"process_messages" : {
    "change_unit_prefix": {
        "name == 'mem_used'": "G",
        "name == 'swap_used'": "G",
        "name == 'mem_total'": "G",
        "name == 'swap_total'": "G",
        "name == 'cpufreq'": "M"
    }
}
Add tags
To add tags set the add_tags_if configuration attribute. The following
statement unconditionally sets a cluster name tag for all metrics.
Note
You always want to set the cluster tag if you are usingcc-metric-collector
within the ClusterCockpit framework!"process_messages" : {
"add_tags_if": [
{
"key": "cluster",
"value": "alex",
"if": "true"
}
]
}
Sinks
A simple example configuration for two sinks: HTTP cc-metric-store and NATS:
{
  "fritzstore": {
    "type": "http",
    "url": "http://monitoring.nhr.fau.de:8082/api/write?cluster=fritz",
    "jwt": "XYZ",
    "idle_connection_timeout": "60s"
  },
  "fritznats": {
    "type": "nats",
    "host": "monitoring.nhr.fau.de",
    "database": "fritz",
    "nkey_file": "/etc/cc-metric-collector/nats.nkey",
  }
}
All metrics are concurrently send to all configured sinks.
Note
cc-metric-store only accepts timestamps in seconds4.7 - Setup of cc-backend
Introduction
cc-backend is the main hub within the ClusterCockpit framework. Its
configuration consists of the general part in config.json and the cluster
configurations in cluster.json files, that are part of the
job archive.
The job archive is a long-term persistent storage for all job meta and metric data.
The job meta data including job statistics as well as the user data are stored
in a SQL database. Secrets as passwords and tokens are provided as environment
variables. Environment variables can be initialized using a .env file residing
in the same directory as cc-backend. If using an .env file environment
variables that are already set take precedence.
Note (cc-backend before v1.5.0)
For versions before v1.5.0 the.env file was the only option to set
environment variables, and they could not be set by other means!Configuration
cc-backend provides a command line switch to generate an initial template for
all required configuration files apart from the job archive:
./cc-backend -init
This will create the ./var folder, generate initial version of the
config.json and .env files, and initialize a sqlite database file.
config.json
Below is a production configuration enabling the following functionality:
- Use HTTPS only
- Mark jobs as short job if smaller than 5m
- Enable authentication and user syncing via an LDAP directory
- Enable to initiate a user session via an JWT token, e.g. by an IDM portal
- Drop permission after privileged ports are taken
- enable re-sampling of time-series metric data for long jobs
- Enable NATS for job and metric store APIs
- Set metric in memory retention to 48h
- Set upper memory capping for internal metric store to 100GB
- Enable archiving of metric data
- Using S3 as job archive backend. Note: The file based archive in
./var/job-archiveis the default.
Not included below but set by the default settings:
- Use compression for metric data files in job archive
- Allow access to the REST API from all IPs
{
  "main": {
    "addr": "0.0.0.0:443",
    "https-cert-file": "/etc/letsencrypt/live/url/fullchain.pem",
    "https-key-file": "/etc/letsencrypt/live/url/privkey.pem",
    "user": "clustercockpit",
    "group": "clustercockpit",
    "short-running-jobs-duration": 300,
    "enable-job-taggers": true,
    "resampling": {
      "minimum-points": 600,
      "trigger": 180,
      "resolutions": [240, 60]
    },
    "api-subjects": {
      "subject-job-event": "cc.job.event",
      "subject-node-state": "cc.node.state"
    }
  },
  "nats": {
    "address": "nats://x.x.x.x:4222",
    "username": "root",
    "password": "root"
  },
  "auth": {
    "jwts": {
      "max-age": "2000h"
    },
    "ldap": {
      "url": "ldaps://hpcldap.rrze.uni-erlangen.de",
      "user_base": "ou=people,ou=hpc,dc=rz,dc=uni,dc=de",
      "search_dn": "cn=hpcmonitoring,ou=roadm,ou=profile,ou=hpc,dc=rz,dc=uni,dc=de",
      "user_bind": "uid={username},ou=people,ou=hpc,dc=rrze,dc=uni,dc=de",
      "user_filter": "(&(objectclass=posixAccount))",
      "sync_interval": "24h"
    }
  },
  "cron": {
    "commit-job-worker": "1m",
    "duration-worker": "5m",
    "footprint-worker": "10m"
  },
  "archive": {
    "kind": "s3",
    "endpoint": "http://x.x.x.x",
    "bucket": "jobarchive",
    "access-key": "xx",
    "secret-key": "xx",
    "retention": {
      "policy": "move",
      "age": 365,
      "location": "./var/archive"
    }
  },
  "metric-store": {
    "memory-cap": 100,
    "retention-in-memory": "48h",
    "cleanup": {
      "mode": "archive",
      "directory": "./var/archive"
    },
    "nats-subscriptions": [
      {
        "subscribe-to": "hpc-nats",
        "cluster-tag": "fritz"
      },
      {
        "subscribe-to": "hpc-nats",
        "cluster-tag": "alex"
      }
    ]
  },
  "ui-file": "ui-config.json"
}
Further reading:
Environment variables
Secrets are provided in terms of environment variables. The only two required
secrets are JWT_PUBLIC_KEY and JWT_PRIVATE_KEY used for signing generated
JWT tokens and validate JWT authentication.
Please refer to the environment reference for details.
5 - How-to Guides
5.1 - Configure retention policies
Overview
Over time, the ClusterCockpit database and job archive can grow significantly, especially in production environments with high job counts. Retention policies help keep your storage at a manageable size by automatically removing or archiving old jobs.
Why use retention policies?
Without retention policies:
- The SQLite database file can grow to tens of gigabytes
- The job archive can reach terabytes in size
- Storage requirements increase indefinitely
- System performance may degrade
A typical multi-cluster setup over 5 years can accumulate:
- 75 GB for the SQLite database
- 1.4 TB for the job archive
Retention policies allow you to balance data retention needs with storage capacity.
Retention policy options
ClusterCockpit supports three retention policies:
None (default)
No automatic cleanup. Jobs are kept indefinitely.
{
  "archive": {
    "kind": "file",
    "path": "./var/job-archive"
  }
}
Delete
Permanently removes jobs older than the specified age from both the job archive and the database.
Use when:
- Storage space is limited
- You don’t need long-term job data
- You have external backups or data exports
Configuration example:
{
  "archive": {
    "kind": "file",
    "path": "./var/job-archive",
    "retention": {
      "policy": "delete",
      "age": 365,
      "include-db": true
    }
  }
}
This configuration will:
- Delete jobs older than 365 days
- Remove them from both the job archive and database
- Run automatically based on the cleanup interval
Move
Moves old jobs to a separate location for long-term archival while removing them from the active database.
Use when:
- You need to preserve historical data
- You want to reduce active database size
- You can store archived data on cheaper, slower storage
Configuration example:
{
  "archive": {
    "kind": "file",
    "path": "./var/job-archive",
    "retention": {
      "policy": "move",
      "age": 365,
      "location": "/mnt/archive/old-jobs",
      "include-db": true
    }
  }
}
This configuration will:
- Move jobs older than 365 days to
/mnt/archive/old-jobs - Remove them from the active database
- Preserve the data for potential future analysis
Configuration parameters
archive.retention section
| Parameter | Type | Required | Default | Description |
|---|---|---|---|---|
policy | string | Yes | - | Retention policy: none, delete, copy, or move |
age | integer | No | 7 | Age threshold in days. Jobs older than this are affected |
include-db | boolean | No | true | Also remove jobs from the database (not just archive) |
omit-tagged | string | No | none | Skip tagged jobs: none = apply to all jobs, all = skip any tagged job, user = skip jobs with user-created tags (auto-tagger tags are not user tags) |
location | string | For move/copy | - | Target directory for moved/copied jobs |
Complete configuration examples
Example 1: One-year retention with deletion
Suitable for environments with limited storage:
{
  "archive": {
    "kind": "file",
    "path": "./var/job-archive",
    "retention": {
      "policy": "delete",
      "age": 365,
      "include-db": true
    }
  }
}
Example 2: Two-tier archival system
Keep 6 months active, move older data to long-term storage:
{
  "archive": {
    "kind": "file",
    "path": "./var/job-archive",
    "retention": {
      "policy": "move",
      "age": 180,
      "location": "/mnt/slow-storage/archive",
      "include-db": true
    }
  }
}
Example 3: S3 backend with retention
Using S3 object storage with one-year retention:
{
  "archive": {
    "kind": "s3",
    "endpoint": "https://s3.example.com",
    "bucket": "clustercockpit-jobs",
    "access-key": "your-access-key",
    "secret-key": "your-secret-key",
    "retention": {
      "policy": "delete",
      "age": 365,
      "include-db": true
    }
  }
}
How retention policies work
- Automatic execution: Retention policies run automatically based on the configured interval
- Age calculation: Jobs are evaluated based on their
startTimefield - Batch processing: All jobs older than the specified age are processed in one operation
- Database cleanup: When
include-db: true, corresponding database entries are removed - Tagged job handling: Controlled by
omit-tagged— useuserto preserve jobs tagged by users while still processing auto-tagged jobs - Archive handling: Based on policy (
deleteremoves,moverelocates)
Best practices
Planning retention periods
Consider these factors when setting the age parameter:
- Accounting requirements: Some organizations require job data for billing/auditing
- Research needs: Longer retention for research clusters where users may need historical data
- Storage capacity: Available disk space and growth rate
- Compliance: Legal or institutional data retention policies
Recommended retention periods:
| Use Case | Suggested Age |
|---|---|
| Development/testing | 30-90 days |
| Production (limited storage) | 180-365 days |
| Production (ample storage) | 365-730 days |
| Research/archival | 730+ days or use move policy |
Storage considerations
For move policy
- Mount the target
locationon slower, cheaper storage (e.g., spinning disks, network storage) - Ensure sufficient space at the target location
- Consider periodic backups of the moved archive
- Document the archive structure for future retrieval
For delete policy
- Create backups first: Always backup your database and job archive before enabling deletion
- Test on a copy: Verify the retention policy works as expected on test data
- Export important data: Consider exporting summary statistics or critical job data before deletion
Monitoring and maintenance
Track archive size: Monitor growth to adjust retention periods
du -sh /var/job-archive
du -sh /path/to/database.db
Verify retention execution: Check logs for retention policy runs
grep -i retention /var/log/cc-backend.logRegular backups: Backup before changing retention settings
cp -r /var/job-archive /backup/job-archive-$(date +%Y%m%d)
cp /var/clustercockpit.db /backup/clustercockpit-$(date +%Y%m%d).db
Restoring deleted jobs
If using move policy
Jobs moved to the retention location can be restored:
Stop
cc-backendUse the
archive-managertool to import jobs back:cd tools/archive-manager go build ./archive-manager -import \ -src-config '{"kind":"file","path":"/mnt/archive/old-jobs"}' \ -dst-config '{"kind":"file","path":"./var/job-archive"}'Rebuild database from archive:
./cc-backend -init-dbRestart
cc-backend
If using delete policy
Jobs cannot be restored unless you have external backups. This is why backups are critical before enabling deletion.
Related tools
- archive-manager: Manage and validate job archives
- archive-migration: Migrate archives between schema versions
- Database migration: See database migration guide
Troubleshooting
Retention policy not running
Check:
- Verify
archive.retentionis properly configured inconfig.json - Ensure
cc-backendwas restarted after configuration changes - Check logs for errors:
grep -i retention /var/log/cc-backend.log
Database size not decreasing
Possible causes:
include-db: false— Database entries are not being removedSQLite doesn’t automatically reclaim space - run
VACUUM:sqlite3 /var/clustercockpit.db "VACUUM;"
Jobs not being moved to target location
Check:
- Target directory exists and is writable
- Sufficient disk space at target location
- File permissions allow
cc-backendto write tolocation - Path in
locationis absolute, not relative
Performance impact
If retention policy execution causes performance issues:
- Consider running during off-peak hours (feature may require manual execution)
- Reduce the number of old jobs by running retention more frequently with shorter age periods
- Use more powerful hardware for the database operations
See also
5.2 - How to set up hierarchical metric collection
Overview
In large HPC clusters, it’s often impractical or undesirable to have every compute node connect directly to the central database. A hierarchical collection setup allows you to:
- Reduce database connections: Instead of hundreds of nodes connecting directly, use aggregation nodes as intermediaries
- Improve network efficiency: Aggregate metrics at rack or partition level before forwarding
- Add processing layers: Filter, transform, or enrich metrics at intermediate collection points
- Increase resilience: Buffer metrics during temporary database outages
This guide shows how to configure multiple cc-metric-collector instances where compute nodes send metrics to aggregation nodes, which then forward them to the backend database.
Architecture
flowchart TD
  subgraph Rack1 ["Rack 1 - Compute Nodes"]
    direction LR
    node1["Node 1<br/>cc-metric-collector"]
    node2["Node 2<br/>cc-metric-collector"]
    node3["Node 3<br/>cc-metric-collector"]
  end

  subgraph Rack2 ["Rack 2 - Compute Nodes"]
    direction LR
    node4["Node 4<br/>cc-metric-collector"]
    node5["Node 5<br/>cc-metric-collector"]
    node6["Node 6<br/>cc-metric-collector"]
  end

  subgraph Aggregator ["Aggregation Node"]
    ccrecv["cc-metric-collector<br/>(with receivers)"]
  end

  subgraph Backend ["Backend Server"]
    ccms[("cc-metric-store")]
    ccweb["cc-backend<br/>(Web Frontend)"]
  end

  node1 --> ccrecv
  node2 --> ccrecv
  node3 --> ccrecv
  node4 --> ccrecv
  node5 --> ccrecv
  node6 --> ccrecv

  ccrecv --> ccms
  ccms <--> ccweb
Components
- Compute Node Collectors: Run on each compute node, collect local metrics, forward to aggregation node
- Aggregation Node: Receives metrics from multiple compute nodes, optionally processes them, forwards to cc-metric-store
- cc-metric-store: In-memory time-series database for metric storage and retrieval
- cc-backend: Web frontend that queries cc-metric-store and visualizes metrics
Configuration
Step 1: Configure Compute Nodes
Compute nodes collect local metrics and send them to the aggregation node using a network sink (NATS or HTTP).
Using NATS (Recommended)
NATS provides better performance, reliability, and built-in clustering support.
config.json:
{
  "sinks-file": "/etc/cc-metric-collector/sinks.json",
  "collectors-file": "/etc/cc-metric-collector/collectors.json",
  "receivers-file": "/etc/cc-metric-collector/receivers.json",
  "router-file": "/etc/cc-metric-collector/router.json",
  "main": {
    "interval": "10s",
    "duration": "1s"
  }
}
sinks.json:
{
  "nats_aggregator": {
    "type": "nats",
    "host": "aggregator.example.org",
    "port": "4222",
    "subject": "metrics.rack1"
  }
}
collectors.json (enable metrics you need):
{
  "cpustat": {},
  "memstat": {},
  "diskstat": {},
  "netstat": {},
  "loadavg": {},
  "tempstat": {}
}
router.json (add identifying tags):
{
  "interval_timestamp": true,
  "process_messages": {
    "manipulate_messages": [
      {
        "add_base_tags": {
          "cluster": "mycluster",
          "rack": "rack1"
        }
      }
    ]
  }
}
receivers.json (empty for compute nodes):
{}
Using HTTP
HTTP is simpler but less efficient for high-frequency metrics.
sinks.json (HTTP alternative):
{
  "http_aggregator": {
    "type": "http",
    "host": "aggregator.example.org",
    "port": "8080",
    "path": "/api/write",
    "idle_connection_timeout": "5s",
    "timeout": "3s"
  }
}
Step 2: Configure Aggregation Node
The aggregation node receives metrics from compute nodes via receivers and forwards them to the backend database.
config.json:
{
  "sinks-file": "/etc/cc-metric-collector/sinks.json",
  "collectors-file": "/etc/cc-metric-collector/collectors.json",
  "receivers-file": "/etc/cc-metric-collector/receivers.json",
  "router-file": "/etc/cc-metric-collector/router.json",
  "main": {
    "interval": "10s",
    "duration": "1s"
  }
}
receivers.json (receive from compute nodes):
{
  "nats_rack1": {
    "type": "nats",
    "address": "localhost",
    "port": "4222",
    "subject": "metrics.rack1"
  },
  "nats_rack2": {
    "type": "nats",
    "address": "localhost",
    "port": "4222",
    "subject": "metrics.rack2"
  }
}
sinks.json (forward to cc-metric-store):
{
  "metricstore": {
    "type": "http",
    "host": "backend.example.org",
    "port": "8082",
    "path": "/api/write",
    "idle_connection_timeout": "5s",
    "timeout": "5s",
    "jwt": "eyJ0eXAiOiJKV1QiLCJhbGciOiJFZERTQSJ9.eyJ1c2VyIjoiYWRtaW4iLCJyb2xlcyI6WyJST0xFX0FETUlOIiwiUk9MRV9VU0VSIl19.d-3_3FZTsadPjDbVXKrQr4jNiQV-B_1-uaL_lW8d8gGb-TSAG9KdMg"
  }
}
Note: The jwt token must be signed with the private key corresponding to the public key configured in cc-metric-store. See JWT generation guide for details.
collectors.json (optionally collect local metrics):
{
  "cpustat": {},
  "memstat": {},
  "loadavg": {}
}
router.json (optionally process metrics):
{
  "interval_timestamp": false,
  "num_cache_intervals": 0,
  "process_messages": {
    "manipulate_messages": [
      {
        "add_base_tags": {
          "datacenter": "dc1"
        }
      }
    ]
  }
}
Step 3: Set Up cc-metric-store
The backend server needs cc-metric-store to receive and store metrics from the aggregation node.
config.json (/etc/cc-metric-store/config.json):
{
  "metrics": {
    "cpu_user": {
      "frequency": 10,
      "aggregation": "avg"
    },
    "cpu_system": {
      "frequency": 10,
      "aggregation": "avg"
    },
    "mem_used": {
      "frequency": 10,
      "aggregation": null
    },
    "mem_total": {
      "frequency": 10,
      "aggregation": null
    },
    "net_bw": {
      "frequency": 10,
      "aggregation": "sum"
    },
    "flops_any": {
      "frequency": 10,
      "aggregation": "sum"
    },
    "mem_bw": {
      "frequency": 10,
      "aggregation": "sum"
    }
  },
  "http-api": {
    "address": "0.0.0.0:8082"
  },
  "jwt-public-key": "kzfYrYy+TzpanWZHJ5qSdMj5uKUWgq74BWhQG6copP0=",
  "retention-in-memory": "48h",
  "checkpoints": {
    "interval": "12h",
    "directory": "/var/lib/cc-metric-store/checkpoints",
    "restore": "48h"
  },
  "archive": {
    "interval": "24h",
    "directory": "/var/lib/cc-metric-store/archive"
  }
}
Important configuration notes:
- metrics: Must list ALL metrics you want to store. Only configured metrics are accepted.
- frequency: Must match the collection interval from cc-metric-collector (in seconds)
- aggregation:
"sum"for resource metrics (bandwidth, FLOPS),"avg"for diagnostic metrics (CPU %),nullfor node-only metrics - jwt-public-key: Must correspond to the private key used to sign JWT tokens in the aggregation node sink configuration
- retention-in-memory: How long to keep metrics in memory (should cover typical job durations)
Install cc-metric-store:
# Download binary
wget https://github.com/ClusterCockpit/cc-metric-store/releases/latest/download/cc-metric-store

# Install
sudo mkdir -p /opt/monitoring/cc-metric-store
sudo mv cc-metric-store /opt/monitoring/cc-metric-store/
sudo chmod +x /opt/monitoring/cc-metric-store/cc-metric-store

# Create directories
sudo mkdir -p /var/lib/cc-metric-store/checkpoints
sudo mkdir -p /var/lib/cc-metric-store/archive
sudo mkdir -p /etc/cc-metric-store
Create systemd service (/etc/systemd/system/cc-metric-store.service):
[Unit]
Description=ClusterCockpit Metric Store
After=network.target

[Service]
Type=simple
User=cc-metricstore
Group=cc-metricstore
WorkingDirectory=/opt/monitoring/cc-metric-store
ExecStart=/opt/monitoring/cc-metric-store/cc-metric-store -config /etc/cc-metric-store/config.json
Restart=always
RestartSec=10

[Install]
WantedBy=multi-user.target
Start cc-metric-store:
# Create user
sudo useradd -r -s /bin/false cc-metricstore
sudo chown -R cc-metricstore:cc-metricstore /var/lib/cc-metric-store

# Start service
sudo systemctl daemon-reload
sudo systemctl start cc-metric-store
sudo systemctl enable cc-metric-store

# Check status
sudo systemctl status cc-metric-store
Step 4: Set Up NATS Server
The aggregation node needs a NATS server to receive metrics from compute nodes.
Install NATS:
# Using Docker
docker run -d --name nats -p 4222:4222 nats:latest

# Using package manager (example for Ubuntu/Debian)
curl -L https://github.com/nats-io/nats-server/releases/download/v2.10.5/nats-server-v2.10.5-linux-amd64.zip -o nats-server.zip
unzip nats-server.zip
sudo mv nats-server-v2.10.5-linux-amd64/nats-server /usr/local/bin/
NATS Configuration (/etc/nats/nats-server.conf):
listen: 0.0.0.0:4222
max_payload: 10MB
max_connections: 1000

# Optional: Enable authentication
authorization {
  user: collector
  password: secure_password
}

# Optional: Enable clustering for HA
cluster {
  name: metrics-cluster
  listen: 0.0.0.0:6222
}
Start NATS:
# Systemd
sudo systemctl start nats
sudo systemctl enable nats

# Or directly
nats-server -c /etc/nats/nats-server.conf
Advanced Configurations
Multiple Aggregation Levels
For very large clusters, you can create multiple aggregation levels:
flowchart TD
  subgraph Compute ["Compute Nodes"]
    node1["Node 1-100"]
  end

  subgraph Rack ["Rack Aggregators"]
    agg1["Aggregator<br/>Rack 1-10"]
  end

  subgraph Cluster ["Cluster Aggregator"]
    agg_main["Main Aggregator"]
  end

  subgraph Backend ["Backend"]
    ccms[("cc-metric-store")]
  end

  node1 --> agg1
  agg1 --> agg_main
  agg_main --> ccms
Rack-level aggregator sinks.json:
{
  "cluster_aggregator": {
    "type": "nats",
    "host": "main-aggregator.example.org",
    "port": "4222",
    "subject": "metrics.cluster"
  }
}
Cluster-level aggregator receivers.json:
{
  "all_racks": {
    "type": "nats",
    "address": "localhost",
    "port": "4222",
    "subject": "metrics.cluster"
  }
}
Load Balancing with Multiple Aggregators
Use NATS queue groups to distribute load across multiple aggregation nodes:
Compute node sinks.json:
{
  "nats_aggregator": {
    "type": "nats",
    "host": "nats-cluster.example.org",
    "port": "4222",
    "subject": "metrics.loadbalanced"
  }
}
Aggregator 1 and 2 receivers.json (identical configuration):
{
  "nats_with_queue": {
    "type": "nats",
    "address": "localhost",
    "port": "4222",
    "subject": "metrics.loadbalanced",
    "queue_group": "aggregators"
  }
}
With queue_group configured, NATS automatically distributes messages across all aggregators in the group.
Filtering at Aggregation Level
Reduce cc-metric-store load by filtering metrics at the aggregation node:
Aggregator router.json:
{
  "interval_timestamp": false,
  "process_messages": {
    "manipulate_messages": [
      {
        "drop_by_name": ["cpu_idle", "cpu_guest", "cpu_guest_nice"]
      },
      {
        "drop_by": "value == 0 && match('temp_', name)"
      },
      {
        "add_base_tags": {
          "aggregated": "true"
        }
      }
    ]
  }
}
Metric Transformation
Aggregate or transform metrics before forwarding:
Aggregator router.json:
{
  "interval_timestamp": false,
  "num_cache_intervals": 1,
  "interval_aggregates": [
    {
      "name": "rack_avg_temp",
      "if": "name == 'temp_package_id_0'",
      "function": "avg(values)",
      "tags": {
        "type": "rack",
        "rack": "<copy>"
      },
      "meta": {
        "unit": "degC",
        "source": "aggregated"
      }
    }
  ]
}
High Availability Setup
Use multiple NATS servers in cluster mode:
NATS server 1 config:
cluster {
  name: metrics-cluster
  listen: 0.0.0.0:6222
  routes: [
    nats://nats2.example.org:6222
    nats://nats3.example.org:6222
  ]
}
Compute node sinks.json (with failover):
{
  "nats_ha": {
    "type": "nats",
    "host": "nats1.example.org,nats2.example.org,nats3.example.org",
    "port": "4222",
    "subject": "metrics.rack1"
  }
}
Deployment
1. Install cc-metric-collector
On all nodes (compute and aggregation):
# Download binary
wget https://github.com/ClusterCockpit/cc-metric-collector/releases/latest/download/cc-metric-collector

# Install
sudo mkdir -p /opt/monitoring/cc-metric-collector
sudo mv cc-metric-collector /opt/monitoring/cc-metric-collector/
sudo chmod +x /opt/monitoring/cc-metric-collector/cc-metric-collector
2. Deploy Configuration Files
Compute nodes:
sudo mkdir -p /etc/cc-metric-collector
sudo cp config.json /etc/cc-metric-collector/
sudo cp sinks.json /etc/cc-metric-collector/
sudo cp collectors.json /etc/cc-metric-collector/
sudo cp receivers.json /etc/cc-metric-collector/
sudo cp router.json /etc/cc-metric-collector/
Aggregation node:
sudo mkdir -p /etc/cc-metric-collector
# Deploy aggregator-specific configs
sudo cp aggregator-config.json /etc/cc-metric-collector/config.json
sudo cp aggregator-sinks.json /etc/cc-metric-collector/sinks.json
sudo cp aggregator-receivers.json /etc/cc-metric-collector/receivers.json
# etc...
3. Create Systemd Service
On all nodes (/etc/systemd/system/cc-metric-collector.service):
[Unit]
Description=ClusterCockpit Metric Collector
After=network.target

[Service]
Type=simple
User=cc-collector
Group=cc-collector
ExecStart=/opt/monitoring/cc-metric-collector/cc-metric-collector -config /etc/cc-metric-collector/config.json
Restart=always
RestartSec=10

[Install]
WantedBy=multi-user.target
4. Start Services
Order of startup:
- Start cc-metric-store on backend server
- Start NATS server on aggregation node
- Start cc-metric-collector on aggregation node
- Start cc-metric-collector on compute nodes
# On backend server
sudo systemctl start cc-metric-store

# On aggregation node
sudo systemctl start nats
sudo systemctl start cc-metric-collector

# On compute nodes
sudo systemctl start cc-metric-collector

# Enable on boot (on all nodes)
sudo systemctl enable cc-metric-store  # backend only
sudo systemctl enable nats              # aggregator only
sudo systemctl enable cc-metric-collector
Testing and Validation
Test Compute Node → Aggregator
On compute node, run once to verify metrics are collected:
cc-metric-collector -config /etc/cc-metric-collector/config.json -once
On aggregation node, check NATS for incoming metrics:
# Subscribe to see messages
nats sub 'metrics.>'
Test Aggregator → cc-metric-store
On aggregation node, verify metrics are forwarded:
# Check logs
journalctl -u cc-metric-collector -f
On backend server, verify cc-metric-store is receiving data:
# Check cc-metric-store logs
journalctl -u cc-metric-store -f

# Query metrics via REST API (requires valid JWT token)
curl -H "Authorization: Bearer $JWT_TOKEN" \
  "http://backend.example.org:8082/api/query?cluster=mycluster&from=$(date -d '5 minutes ago' +%s)&to=$(date +%s)"
Validate End-to-End
Check cc-backend to see if metrics appear for all nodes:
- Open cc-backend web interface
- Navigate to node view
- Verify metrics are displayed for compute nodes
- Check that tags (cluster, rack, etc.) are present
Monitoring and Troubleshooting
Check Collection Pipeline
# Compute node: metrics are being sent
journalctl -u cc-metric-collector -n 100 | grep -i "sent\|error"

# Aggregator: metrics are being received
journalctl -u cc-metric-collector -n 100 | grep -i "received\|error"

# NATS: check connections
nats server info
nats server list
Common Issues
Metrics not appearing in cc-metric-store:
- Check compute node → NATS connection
- Verify NATS → aggregator reception
- Check aggregator → cc-metric-store sink (verify JWT token is valid)
- Verify metrics are configured in cc-metric-store’s config.json
- Examine router filters (may be dropping metrics)
High latency:
- Reduce metric collection interval on compute nodes
- Increase batch size in aggregator sinks
- Add more aggregation nodes with load balancing
- Check network bandwidth between tiers
Memory growth on aggregator:
- Reduce
num_cache_intervalsin router - Check sink write performance
- Verify cc-metric-store is accepting writes
- Monitor NATS queue depth
Memory growth on cc-metric-store:
- Reduce
retention-in-memorysetting - Increase checkpoint frequency
- Verify archive cleanup is working
Connection failures:
- Verify firewall rules allow NATS port (4222)
- Check NATS server is running and accessible
- Test network connectivity:
telnet aggregator.example.org 4222 - Review NATS server logs:
journalctl -u nats -f
Performance Tuning
Compute nodes (reduce overhead):
{
  "main": {
    "interval": "30s",
    "duration": "1s"
  }
}
Aggregator (increase throughput):
{
  "metricstore": {
    "type": "http",
    "host": "backend.example.org",
    "port": "8082",
    "path": "/api/write",
    "timeout": "10s",
    "idle_connection_timeout": "10s"
  }
}
NATS server (handle more connections):
max_connections: 10000
max_payload: 10MB
write_deadline: "10s"
Security Considerations
NATS Authentication
NATS server config:
authorization {
  users = [
    {
      user: "collector"
      password: "$2a$11$..."  # bcrypt hash
    }
  ]
}
Compute node sinks.json:
{
  "nats_aggregator": {
    "type": "nats",
    "host": "aggregator.example.org",
    "port": "4222",
    "subject": "metrics.rack1",
    "username": "collector",
    "password": "secure_password"
  }
}
TLS Encryption
NATS server config:
tls {
  cert_file: "/etc/nats/certs/server-cert.pem"
  key_file: "/etc/nats/certs/server-key.pem"
  ca_file: "/etc/nats/certs/ca.pem"
  verify: true
}
Compute node sinks.json:
{
  "nats_aggregator": {
    "type": "nats",
    "host": "aggregator.example.org",
    "port": "4222",
    "subject": "metrics.rack1",
    "ssl": true,
    "ssl_cert": "/etc/cc-metric-collector/certs/client-cert.pem",
    "ssl_key": "/etc/cc-metric-collector/certs/client-key.pem"
  }
}
Firewall Rules
On aggregation node:
# Allow NATS from compute network
sudo firewall-cmd --permanent --add-rich-rule='rule family="ipv4" source address="10.0.0.0/8" port protocol="tcp" port="4222" accept'

sudo firewall-cmd --reload
On backend server:
# Allow HTTP from aggregation node to cc-metric-store
sudo firewall-cmd --permanent --add-rich-rule='rule family="ipv4" source address="aggregator.example.org" port protocol="tcp" port="8082" accept'

sudo firewall-cmd --reload
Alternative: Using NATS for cc-metric-store
Instead of HTTP, you can also use NATS to send metrics from the aggregation node to cc-metric-store.
Aggregation node sinks.json:
{
  "nats_metricstore": {
    "type": "nats",
    "host": "backend.example.org",
    "port": "4222",
    "subject": "metrics.store"
  }
}
cc-metric-store config.json (add NATS section):
{
  "metrics": { ... },
  "nats": {
    "address": "nats://0.0.0.0:4222",
    "subscriptions": [
      {
        "subscribe-to": "metrics.store",
        "cluster-tag": "mycluster"
      }
    ]
  },
  "http-api": { ... },
  "jwt-public-key": "...",
  "retention-in-memory": "48h",
  "checkpoints": { ... },
  "archive": { ... }
}
Benefits of NATS:
- Better performance for high-frequency metrics
- Built-in message buffering
- No need for JWT tokens in sink configuration
- Easier to scale with multiple aggregators
Trade-offs:
- Requires running NATS server on backend
- More complex infrastructure
See Also
5.3 - Database migrations
Introduction
In general, an upgrade is nothing more than a replacement of the binary file. All the necessary files, except the database file, the configuration file and the job archive, are embedded in the binary file. It is recommended to use a directory where the file names of the binary files are named with a version indicator. This can be, for example, the date or the Unix epoch time. A symbolic link points to the version to be used. This makes it easier to switch to earlier versions.
The database and the job archive are versioned. Each release binary supports specific versions of the database and job archive. If a version mismatch is detected, the application is terminated and migration is required.
cc-backend and copying the sqlite database file
somewhere.Migrating the database
After you have backed up the database, run the following command to migrate the database to the latest version:
> ./cc-backend -migrate-db
The migration files are embedded in the binary and can also be viewed in the cc backend source tree. We use the migrate library.
If something goes wrong, you can check the status and get the current schema (here for sqlite):
> sqlite3 var/job.db
In the sqlite console execute:
.schema
to get the current database schema. You can query the current version and whether the migration failed with:
SELECT * FROM schema_migrations;
The first column indicates the current database version and the second column is a dirty flag indicating whether the migration was successful.
5.4 - Job archive migrations
Introduction
In general, an upgrade is nothing more than a replacement of the binary file. All the necessary files, except the database file, the configuration file and the job archive, are embedded in the binary file. It is recommended to use a directory where the file names of the binary files are named with a version indicator. This can be, for example, the date or the Unix epoch time. A symbolic link points to the version to be used. This makes it easier to switch to earlier versions.
Migrating the job archive
Notice
Don’t forget to also migrate archive jobs in case you use an archive retention policy!. Archive migration is only supported from the previous archive version.Job archive migration requires a separate tool (archive-migration), which is
part of the cc-backend source tree (build with go build ./tools/archive-migration)
and is also provided as part of the releases.
Migration is supported only between two successive releases.
You find details how to use the archive-migration tool in its reference
documentation
The cluster.json files in job-archive-new must be checked for errors, especially
whether the aggregation attribute is set correctly for all metrics.
Migration takes a few hours for large job archives (several hundred GB). A versioned job archive contains a version.txt file in the root directory of the job archive. This file contains the version as an unsigned integer.
5.5 -
5.6 - Hands-On Demo
Prerequisites
- perl
- go
- npm
- Optional: curl
- Script migrateTimestamp.pl
Documentation
You find READMEs or api docs in
- ./cc-backend/configs
- ./cc-backend/init
- ./cc-backend/api
ClusterCockpit configuration files
cc-backend
./.envPasswords and Tokens set in the environment./config.jsonConfiguration options for cc-backend
cc-metric-store
./config.jsonOptional to overwrite configuration options
cc-metric-collector
Not yet included in the hands-on setup.
Setup Components
Start by creating a base folder for all of the following steps.
mkdir clustercockpitcd clustercockpit
Setup cc-backend
- Clone Repository
git clone https://github.com/ClusterCockpit/cc-backend.gitcd cc-backend
- Build
make
- Activate & configure environment for cc-backend
cp configs/env-template.txt .env- Optional: Have a look via
vim .env - Copy the
config.jsonfile included in this tarball into the root directory of cc-backend:cp ../../config.json ./
- Back to toplevel
clustercockpitcd ..
- Prepare Datafolder and Database file
mkdir var./cc-backend -migrate-db
Setup cc-metric-store
- Clone Repository
git clone https://github.com/ClusterCockpit/cc-metric-store.gitcd cc-metric-store
- Build Go Executable
go getgo build
- Prepare Datafolders
mkdir -p var/checkpointsmkdir -p var/archive
- Update Config
vim config.json- Exchange existing setting in
metricswith the following:
"clock":      { "frequency": 60, "aggregation": null },
"cpi":        { "frequency": 60, "aggregation": null },
"cpu_load":   { "frequency": 60, "aggregation": null },
"flops_any":  { "frequency": 60, "aggregation": null },
"flops_dp":   { "frequency": 60, "aggregation": null },
"flops_sp":   { "frequency": 60, "aggregation": null },
"ib_bw":      { "frequency": 60, "aggregation": null },
"lustre_bw":  { "frequency": 60, "aggregation": null },
"mem_bw":     { "frequency": 60, "aggregation": null },
"mem_used":   { "frequency": 60, "aggregation": null },
"rapl_power": { "frequency": 60, "aggregation": null }
- Back to toplevel
clustercockpitcd ..
Setup Demo Data
mkdir source-datacd source-data- Download JobArchive-Source:
wget https://hpc-mover.rrze.uni-erlangen.de/HPC-Data/0x7b58aefb/eig7ahyo6fo2bais0ephuf2aitohv1ai/job-archive-dev.tar.xztar xJf job-archive-dev.tar.xzmv ./job-archive ./job-archive-sourcerm ./job-archive-dev.tar.xz
- Download CC-Metric-Store Checkpoints:
mkdir -p cc-metric-store-source/checkpointscd cc-metric-store-source/checkpointswget https://hpc-mover.rrze.uni-erlangen.de/HPC-Data/0x7b58aefb/eig7ahyo6fo2bais0ephuf2aitohv1ai/cc-metric-store-checkpoints.tar.xztar xf cc-metric-store-checkpoints.tar.xzrm cc-metric-store-checkpoints.tar.xz
- Back to
source-datacd ../..
- Run timestamp migration script. This may take tens of minutes!
cp ../migrateTimestamps.pl ../migrateTimestamps.pl- Expected output:
Starting to update start- and stoptimes in job-archive for emmy
Starting to update start- and stoptimes in job-archive for woody
Done for job-archive
Starting to update checkpoint filenames and data starttimes for emmy
Starting to update checkpoint filenames and data starttimes for woody
Done for checkpoints
- Copy
cluster.jsonfiles from source to migrated folderscp source-data/job-archive-source/emmy/cluster.json cc-backend/var/job-archive/emmy/cp source-data/job-archive-source/woody/cluster.json cc-backend/var/job-archive/woody/
- Initialize Job-Archive in SQLite3 job.db and add demo user
cd cc-backend./cc-backend -init-db -add-user demo:admin:demo- Expected output:
<6>[INFO]    new user "demo" created (roles: ["admin"], auth-source: 0)
<6>[INFO]    Building job table...
<6>[INFO]    A total of 3936 jobs have been registered in 1.791 seconds.
- Back to toplevel
clustercockpitcd ..
Startup both Apps
- In cc-backend root:
$./cc-backend -server -dev- Starts Clustercockpit at
http:localhost:8080- Log:
<6>[INFO] HTTP server listening at :8080...
- Log:
- Use local internet browser to access interface
- You should see and be able to browse finished Jobs
- Metadata is read from SQLite3 database
- Metricdata is read from job-archive/JSON-Files
- Create User in settings (top-right corner)
- Name
apiuser - Username
apiuser - Role
API - Submit & Refresh Page
- Name
- Create JTW for
apiuser- In Userlist, press
Gen. JTWforapiuser - Save JWT for later use
- In Userlist, press
- Starts Clustercockpit at
- In cc-metric-store root:
$./cc-metric-store- Start the cc-metric-store on
http:localhost:8081, Log:
- Start the cc-metric-store on
2022/07/15 17:17:42 Loading checkpoints newer than 2022-07-13T17:17:42+02:00
2022/07/15 17:17:45 Checkpoints loaded (5621 files, 319 MB, that took 3.034652s)
2022/07/15 17:17:45 API http endpoint listening on '0.0.0.0:8081'
- Does not have a graphical interface
- Otpional: Test function by executing:
$ curl -H "Authorization: Bearer eyJ0eXAiOiJKV1QiLCJhbGciOiJFZERTQSJ9.eyJ1c2VyIjoiYWRtaW4iLCJyb2xlcyI6WyJST0xFX0FETUlOIiwiUk9MRV9BTkFMWVNUIiwiUk9MRV9VU0VSIl19.d-3_3FZTsadPjDEdsWrrQ7nS0edMAR4zjl-eK7rJU3HziNBfI9PDHDIpJVHTNN5E5SlLGLFXctWyKAkwhXL-Dw" -D - "http://localhost:8081/api/query" -d "{ \"cluster\": \"emmy\", \"from\": $(expr $(date +%s) - 60), \"to\": $(date +%s), \"queries\": [{
  \"metric\": \"flops_any\",
  \"host\": \"e1111\"
}] }"

HTTP/1.1 200 OK
Content-Type: application/json
Date: Fri, 15 Jul 2022 13:57:22 GMT
Content-Length: 119
{"results":[[JSON-DATA-ARRAY]]}
Development API web interfaces
The -dev flag enables web interfaces to document and test the apis:
- Local GQL Playgorund - A GraphQL playground. To use it you must have a authenticated session in the same browser.
- Local Swagger Docs - A Swagger UI. To use it you have to be logged out, so no user session in the same browser. Use the JWT token with role Api generate previously to authenticate via http header.
Use cc-backend API to start job
Enter the URL
http://localhost:8080/swagger/index.htmlin your browser.Enter your JWT token you generated for the API user by clicking the green Authorize button in the upper right part of the window.
Click the
/job/start_jobendpoint and click the Try it out button.Enter the following json into the request body text area and fill in a recent start timestamp by executing
date +%s.:
{
    "jobId":         100000,
    "arrayJobId":    0,
    "user":          "ccdemouser",
    "subCluster":    "main",
    "cluster":       "emmy",
    "startTime":    <date +%s>,
    "project":       "ccdemoproject",
    "resources":  [
        {"hostname":  "e0601"},
        {"hostname":  "e0823"},
        {"hostname":  "e0337"},
        {"hostname": "e1111"}],
    "numNodes":      4,
    "numHwthreads":  80,
    "walltime":      86400
}
- The response body should be the database id of the started job, for example:
{
  "id": 3937
}
- Check in ClusterCockpit
- User
ccdemousershould appear in Users-Tab with one running job - It could take up to 5 Minutes until the Job is displayed with some current data (5 Min Short-Job Filter)
- Job then is marked with a green
runningtag - Metricdata displayed is read from cc-metric-store!
- User
Use cc-backend API to stop job
- Enter the URL
http://localhost:8080/swagger/index.htmlin your browser. - Enter your JWT token you generated for the API user by clicking the green Authorize button in the upper right part of the window.
- Click the
/job/stop_job/{id}endpoint and click the Try it out button. - Enter the database id at id that was returned by
start_joband copy the following into the request body. Replace the timestamp with a recent one:
{
  "cluster": "emmy",
  "jobState": "completed",
  "stopTime": <RECENT TS>
}
On success a json document with the job meta data is returned.
Check in ClusterCockpit
- User
ccdemousershould appear in Users-Tab with one completed job - Job is no longer marked with a green
runningtag -> Completed! - Metricdata displayed is now read from job-archive!
- User
Check in job-archive
cd ./cc-backend/var/job-archive/emmy/100/000cd $STARTTIME- Inspect
meta.jsonanddata.json
Helper scripts
- In this tarball you can find the perl script
generate_subcluster.plthat helps to generate the subcluster section for your system. Usage: - Log into an exclusive cluster node.
- The LIKWID tools likwid-topology and likwid-bench must be in the PATH!
$./generate_subcluster.ploutputs the subcluster section onstdout
Please be aware that
- You have to enter the name and node list for the subCluster manually.
- GPU detection only works if LIKWID was build with Cuda avalable and you run likwid-topology also with Cuda loaded.
- Do not blindly trust the measured peakflops values.
- Because the script blindly relies on the CSV format output by likwid-topology this is a fragile undertaking!
5.7 - How to add a MOD notification banner
Overview
To add a notification banner you can add a file notice.txt to the ./var
directory of the cc-backend server. As long as this file is present all text
in this file is shown in an info banner on the homepage.
Add notification banner in web interface
As an alternative the admin role can also add and edit the notification banner
from the settings view.
5.8 - How to create a `cluster.json` file
Overview
Every cluster is configured using a dedicated cluster.json file, that is part
of the job archive. You can find the JSON schema for it
here.
This file provides information about the homogeneous hardware partitions within
the cluster including the node topology and the metric list. A real production
configuration is provided as part of
cc-examples.
cluster.json: Basics
The cluster.json file contains three top level parts: the name of the cluster,
the metric configuration, and the subcluster list.
You find the latest cluster.json schema
here.
Basic layout of cluster.json files:
{
  "name": "fritz",
  "metricConfig": [
    {
      "name": "cpu_load",
      ...
    },
    {
      "name": "mem_used",
      ...
    }
  ],
  "subClusters": [
    {
      "name": "main",
      ...
    },
    {
      "name": "spr",
      ...
    }
  ]
}
cluster.json: Metric configuration
There is one metric list per cluster. You can find a list of recommended metrics and their naming here. Example for a metric list entry with only the required attributes:
"metricConfig": [
    {
        "name": "flops_sp",
        "unit": {
            "base": "Flops/s",
            "prefix": "G"
        },
        "scope": "hwthread",
        "timestep": 60,
        "aggregation": "sum",
        "peak": 5600,
        "normal": 1000,
        "caution": 200,
        "alert": 50
    }
]
Explanation of required attributes:
name: The metric name.unit: The metrics unit. Base can be:B(for bytes),F(for flops),B/s,F/s,Flops(for floating point operations),Flops/s(for FLOP rate),CPI(for cycles per instruction),IPC(for instructions per cycle),Hz,W(for Watts),°C, or empty string for no unit. Prefix can be:K,M,G,T,P, orE.scope: The native metric measurement resolution. Can benode,socket,memoryDomain,core,hwthread, oraccelerator.timestep: The measurement frequency in secondsaggregation: How the metric is aggregated with in node topology. Can be one ofsum,avg, or empty string for no aggregation (node level metrics).- Metric thresholds. If threshold applies for larger or smaller values depends
on optional attribute
lowerIsBetter(default false).peak: The maximum possible metric valuenormal: A common metric value levelcaution: Metric value requires attentionalert: Metric value requiring immediate attention
Optional attributes:
footprint: Is this a job footprint metric. Set to how the footprint is aggregated: Canavg,min, ormax. Footprint metrics are shown in the footprint UI component and job view polar plot.energy: Should the metric be used to calculate the job energy. Can bepower(metric has unit Watts) orenergy(metric has unit Joules).lowerIsBetter: Is lower better. Influences frontend UI and evaluation of metric thresholds. Default isfalse.restrict: Whether to restrict visibility of this metric to non-user roles (admin, support, manager). Default isfalse. When set totrue, regular users cannot view this metric.subClusters(Type: array of objects): Overwrites for specific subClusters. The metrics per default are valid for all subClusters. It is possible to overwrite or remove metrics for specific subClusters. If a metric is overwritten for a subClusters all attributes have to be set, partial overwrites are not supported. Example for a metric overwrite:
{
    "name": "mem_used",
    "unit": {
        "base": "B",
        "prefix": "G"
    },
    "scope": "node",
    "aggregation": "sum",
    "footprint": "max",
    "timestep": 60,
    "lowerIsBetter": true,
    "peak": 256,
    "normal": 128,
    "caution": 200,
    "alert": 240,
    "subClusters": [
        {
            "name": "spr1tb",
            "footprint": "max",
            "peak": 1024,
            "normal": 512,
            "caution": 900,
            "alert": 1000
        },
        {
            "name": "spr2tb",
            "footprint": "max",
            "peak": 2048,
            "normal": 1024,
            "caution": 1800,
            "alert": 2000
        }
    ]
},
This metric characterizes the memory capacity used by a job. Aggregation for a job is the sum of all node values. As footprint the largest allocated memory capacity is used. For this configuration lower is better is set, which results in jobs with more than the metric thresholds are marked. There exist two subClusters with 1TB and 2TB memory capacity compared to the default 256GB.
Example for removing metrics for a subcluster:
{
  "name": "vectorization_ratio",
  "unit": {
    "base": ""
  },
  "scope": "hwthread",
  "aggregation": "avg",
  "timestep": 60,
  "peak": 100,
  "normal": 60,
  "caution": 40,
  "alert": 10,
  "subClusters": [
    {
      "name": "icelake",
      "remove": true
    }
  ]
}
cluster.json: subcluster configuration
SubClusters in ClusterCockpit are subsets of a cluster with homogeneous hardware. The subCluster part specifies the node topology, a list of nodes that are part of a subClusters, and the node capabilities that are used to draw the roofline diagrams.
Topology Structure
The topology section defines the hardware topology using nested arrays that map
relationships between hardware threads, cores, sockets, memory domains, and dies:
node: Flat list of all hardware thread IDs on the nodesocket: Hardware threads grouped by physical CPU socket (2D array)memoryDomain: Hardware threads grouped by NUMA domain (2D array)die: Optional grouping by CPU die within sockets (2D array). This is used for multi-die processors where each socket contains multiple dies. If not applicable, use an empty array[]core: Hardware threads grouped by physical core (2D array)accelerators: Optional list of attached accelerators (GPUs, FPGAs, etc.)
The resource ID for CPU cores is the OS processor ID. For GPUs we recommend using the PCI-E address as resource ID.
Here is an example:
{
  "name": "icelake",
  "nodes": "w22[01-35],w23[01-35],w24[01-20],w25[01-20]",
  "processorType": "Intel Xeon Gold 6326",
  "socketsPerNode": 2,
  "coresPerSocket": 16,
  "threadsPerCore": 1,
  "flopRateScalar": {
    "unit": {
      "base": "F/s",
      "prefix": "G"
    },
    "value": 432
  },
  "flopRateSimd": {
    "unit": {
      "base": "F/s",
      "prefix": "G"
    },
    "value": 9216
  },
  "memoryBandwidth": {
    "unit": {
      "base": "B/s",
      "prefix": "G"
    },
    "value": 350
  },
  "topology": {
    "node": [
      0, 1, 2, 3, 4, 5, 6, 7, 8, 9, 10, 11, 12, 13, 14, 15, 16, 17, 18, 19, 20,
      21, 22, 23, 24, 25, 26, 27, 28, 29, 30, 31, 32, 33, 34, 35, 36, 37, 38,
      39, 40, 41, 42, 43, 44, 45, 46, 47, 48, 49, 50, 51, 52, 53, 54, 55, 56,
      57, 58, 59, 60, 61, 62, 63, 64, 65, 66, 67, 68, 69, 70, 71
    ],
    "socket": [
      [
        0, 1, 2, 3, 4, 5, 6, 7, 8, 9, 10, 11, 12, 13, 14, 15, 16, 17, 18, 19,
        20, 21, 22, 23, 24, 25, 26, 27, 28, 29, 30, 31, 32, 33, 34, 35
      ],
      [
        36, 37, 38, 39, 40, 41, 42, 43, 44, 45, 46, 47, 48, 49, 50, 51, 52, 53,
        54, 55, 56, 57, 58, 59, 60, 61, 62, 63, 64, 65, 66, 67, 68, 69, 70, 71
      ]
    ],
    "memoryDomain": [
      [0, 1, 2, 3, 4, 5, 6, 7, 8, 9, 10, 11, 12, 13, 14, 15, 16, 17],
      [18, 19, 20, 21, 22, 23, 24, 25, 26, 27, 28, 29, 30, 31, 32, 33, 34, 35],
      [36, 37, 38, 39, 40, 41, 42, 43, 44, 45, 46, 47, 48, 49, 50, 51, 52, 53],
      [54, 55, 56, 57, 58, 59, 60, 61, 62, 63, 64, 65, 66, 67, 68, 69, 70, 71]
    ],
    "die": [],
    "core": [
      [0],
      [1],
      [2],
      [3],
      [4],
      [5],
      [6],
      [7],
      [8],
      [9],
      [10],
      [11],
      [12],
      [13],
      [14],
      [15],
      [16],
      [17],
      [18],
      [19],
      [20],
      [21],
      [22],
      [23],
      [24],
      [25],
      [26],
      [27],
      [28],
      [29],
      [30],
      [31],
      [32],
      [33],
      [34],
      [35],
      [36],
      [37],
      [38],
      [39],
      [40],
      [41],
      [42],
      [43],
      [44],
      [45],
      [46],
      [47],
      [48],
      [49],
      [50],
      [51],
      [52],
      [53],
      [54],
      [55],
      [56],
      [57],
      [58],
      [59],
      [60],
      [61],
      [62],
      [63],
      [64],
      [65],
      [66],
      [67],
      [68],
      [69],
      [70],
      [71]
    ]
  }
}
Since it is tedious to write this by hand, we provide a
Perl script
as part of cc-backend that generates a subCluster template. This script only
works if the LIKWID tools are installed and in the PATH. You also need the
LIKWID library for cc-metric-store. You find instructions on how to install
LIKWID here.
Example: SubCluster with GPU Accelerators
Here is an example for a subCluster with GPU accelerators:
{
  "name": "a100m80",
  "nodes": "a[0531-0537],a[0631-0633],a0731,a[0831-0833],a[0931-0934]",
  "processorType": "AMD Milan",
  "socketsPerNode": 2,
  "coresPerSocket": 64,
  "threadsPerCore": 1,
  "flopRateScalar": {
    "unit": {
      "base": "F/s",
      "prefix": "G"
    },
    "value": 432
  },
  "flopRateSimd": {
    "unit": {
      "base": "F/s",
      "prefix": "G"
    },
    "value": 9216
  },
  "memoryBandwidth": {
    "unit": {
      "base": "B/s",
      "prefix": "G"
    },
    "value": 400
  },
  "topology": {
    "node": [
      0, 1, 2, 3, 4, 5, 6, 7, 8, 9, 10, 11, 12, 13, 14, 15, 16, 17, 18, 19, 20,
      21, 22, 23, 24, 25, 26, 27, 28, 29, 30, 31, 32, 33, 34, 35, 36, 37, 38,
      39, 40, 41, 42, 43, 44, 45, 46, 47, 48, 49, 50, 51, 52, 53, 54, 55, 56,
      57, 58, 59, 60, 61, 62, 63, 64, 65, 66, 67, 68, 69, 70, 71, 72, 73, 74,
      75, 76, 77, 78, 79, 80, 81, 82, 83, 84, 85, 86, 87, 88, 89, 90, 91, 92,
      93, 94, 95, 96, 97, 98, 99, 100, 101, 102, 103, 104, 105, 106, 107, 108,
      109, 110, 111, 112, 113, 114, 115, 116, 117, 118, 119, 120, 121, 122, 123,
      124, 125, 126, 127
    ],
    "socket": [
      [
        0, 1, 2, 3, 4, 5, 6, 7, 8, 9, 10, 11, 12, 13, 14, 15, 16, 17, 18, 19,
        20, 21, 22, 23, 24, 25, 26, 27, 28, 29, 30, 31, 32, 33, 34, 35, 36, 37,
        38, 39, 40, 41, 42, 43, 44, 45, 46, 47, 48, 49, 50, 51, 52, 53, 54, 55,
        56, 57, 58, 59, 60, 61, 62, 63
      ],
      [
        64, 65, 66, 67, 68, 69, 70, 71, 72, 73, 74, 75, 76, 77, 78, 79, 80, 81,
        82, 83, 84, 85, 86, 87, 88, 89, 90, 91, 92, 93, 94, 95, 96, 97, 98, 99,
        100, 101, 102, 103, 104, 105, 106, 107, 108, 109, 110, 111, 112, 113,
        114, 115, 116, 117, 118, 119, 120, 121, 122, 123, 124, 125, 126, 127
      ]
    ],
    "memoryDomain": [
      [
        0, 1, 2, 3, 4, 5, 6, 7, 8, 9, 10, 11, 12, 13, 14, 15, 16, 17, 18, 19,
        20, 21, 22, 23, 24, 25, 26, 27, 28, 29, 30, 31, 32, 33, 34, 35, 36, 37,
        38, 39, 40, 41, 42, 43, 44, 45, 46, 47, 48, 49, 50, 51, 52, 53, 54, 55,
        56, 57, 58, 59, 60, 61, 62, 63, 64, 65, 66, 67, 68, 69, 70, 71, 72, 73,
        74, 75, 76, 77, 78, 79, 80, 81, 82, 83, 84, 85, 86, 87, 88, 89, 90, 91,
        92, 93, 94, 95, 96, 97, 98, 99, 100, 101, 102, 103, 104, 105, 106, 107,
        108, 109, 110, 111, 112, 113, 114, 115, 116, 117, 118, 119, 120, 121,
        122, 123, 124, 125, 126, 127
      ]
    ],
    "core": [
      [0],
      [1],
      [2],
      [3],
      [4],
      [5],
      [6],
      [7],
      [8],
      [9],
      [10],
      [11],
      [12],
      [13],
      [14],
      [15],
      [16],
      [17],
      [18],
      [19],
      [20],
      [21],
      [22],
      [23],
      [24],
      [25],
      [26],
      [27],
      [28],
      [29],
      [30],
      [31],
      [32],
      [33],
      [34],
      [35],
      [36],
      [37],
      [38],
      [39],
      [40],
      [41],
      [42],
      [43],
      [44],
      [45],
      [46],
      [47],
      [48],
      [49],
      [50],
      [51],
      [52],
      [53],
      [54],
      [55],
      [56],
      [57],
      [58],
      [59],
      [60],
      [61],
      [62],
      [63],
      [64],
      [65],
      [66],
      [67],
      [68],
      [69],
      [70],
      [71],
      [73],
      [74],
      [75],
      [76],
      [77],
      [78],
      [79],
      [80],
      [81],
      [82],
      [83],
      [84],
      [85],
      [86],
      [87],
      [88],
      [89],
      [90],
      [91],
      [92],
      [93],
      [94],
      [95],
      [96],
      [97],
      [98],
      [99],
      [100],
      [101],
      [102],
      [103],
      [104],
      [105],
      [106],
      [107],
      [108],
      [109],
      [110],
      [111],
      [112],
      [113],
      [114],
      [115],
      [116],
      [117],
      [118],
      [119],
      [120],
      [121],
      [122],
      [123],
      [124],
      [125],
      [126],
      [127]
    ],
    "accelerators": [
      {
        "id": "00000000:0E:00.0",
        "type": "Nvidia GPU",
        "model": "A100"
      },
      {
        "id": "00000000:13:00.0",
        "type": "Nvidia GPU",
        "model": "A100"
      },
      {
        "id": "00000000:49:00.0",
        "type": "Nvidia GPU",
        "model": "A100"
      },
      {
        "id": "00000000:4F:00.0",
        "type": "Nvidia GPU",
        "model": "A100"
      },
      {
        "id": "00000000:90:00.0",
        "type": "Nvidia GPU",
        "model": "A100"
      },
      {
        "id": "00000000:96:00.0",
        "type": "Nvidia GPU",
        "model": "A100"
      },
      {
        "id": "00000000:CC:00.0",
        "type": "Nvidia GPU",
        "model": "A100"
      },
      {
        "id": "00000000:D1:00.0",
        "type": "Nvidia GPU",
        "model": "A100"
      }
    ]
  }
}
Important: Each accelerator requires three fields:
id: Unique identifier (PCI-E address recommended, e.g., “00000000:0E:00.0”)type: Type of accelerator. Valid values are:"Nvidia GPU","AMD GPU","Intel GPU"model: Specific model name (e.g., “A100”, “MI100”)
You must ensure that the metric collector as well as the Slurm adapter also uses the same identifier format (PCI-E address) as the accelerator resource ID for consistency.
5.9 - How to customize cc-backend
Overview
Customizing cc-backend means changing the logo, legal texts, and the login
template instead of the placeholders. You can also place a text file in ./var
to add dynamic status or notification messages to the ClusterCockpit homepage.
Replace legal texts
To replace the imprint.tmpl and privacy.tmpl legal texts, you can place your
version in ./var/. At startup cc-backend will check if ./var/imprint.tmpl and/or
./var/privacy.tmpl exist and use them instead of the built-in placeholders.
You can use the placeholders in web/templates as a blueprint.
Replace login template
To replace the default login layout and styling, you can place your version in
./var/. At startup cc-backend will check if ./var/login.tmpl exist and use
it instead of the built-in placeholder. You can use the default template
web/templates/login.tmpl as a blueprint.
Replace logo
To change the logo displayed in the navigation bar, you can provide the file
logo.png in the folder ./var/img/. On startup cc-backend will check if the
folder exists and use the images provided there instead of the built-in images.
You may also place additional images there you use in a custom login template.
Add notification banner on homepage
To add a notification banner you can add a file notice.txt to ./var. As long
as this file is present all text in this file is shown in an info banner on the
homepage.
5.10 - How to deploy and update cc-backend
Workflow for deployment
Why we do not provide a docker container
The ClusterCockpit web backend binary has no external dependencies, everything is included in the binary. The external assets, SQL database and job archive, would also be external in a docker setup. The only advantage of a docker setup would be that the initial configuration is automated. But this only needs to be done one time. We therefore think that setting up docker, securing and maintaining it is not worth the effort.It is recommended to install all ClusterCockpit components in a common directory, e.g. /opt/monitoring, var/monitoring or var/clustercockpit.
In the following we use /opt/monitoring.
Two systemd services run on the central monitoring server:
- clustercockpit : binary cc-backend in
/opt/monitoring/cc-backend. - cc-metric-store : Binary cc-metric-store in
/opt/monitoring/cc-metric-store.
ClusterCockpit is deployed as a single binary that embeds all static assets.
We recommend keeping all cc-backend binary versions in a folder archive and
linking the currently active one from the cc-backend root.
This allows for easy roll-back in case something doesn’t work.
Please Note
cc-backend is started with root rights to open the privileged ports (80 and
443). It is recommended to set the configuration options user and group, in
which case cc-backend will drop root permissions once the ports are taken.
You have to take care, that the ownership of the ./var folder and
its contents are set accordingly.Workflow to update
This example assumes the DB and job archive versions did not change. In case the new binary requires a newer database or job archive version read here how to migrate to newer versions.
- Stop systemd service:
sudo systemctl stop clustercockpit.service
- Backup the sqlite DB file! This is as simple as to copy it.
- Copy new
cc-backendbinary to/opt/monitoring/cc-backend/archive(Tip: Use a date tag likeYYYYMMDD-cc-backend). Here is an example:
cp ~/cc-backend /opt/monitoring/cc-backend/archive/20231124-cc-backend
- Link from
cc-backendroot to current version
ln -s /opt/monitoring/cc-backend/archive/20231124-cc-backend /opt/monitoring/cc-backend/cc-backend
- Start systemd service:
sudo systemctl start clustercockpit.service
- Check if everything is ok:
sudo systemctl status clustercockpit.service
- Check log for issues:
sudo journalctl -u clustercockpit.service
- Check the ClusterCockpit web frontend and your Slurm adapters if anything is broken!
5.11 - How to enable and configure auto-tagging
Overview
ClusterCockpit provides automatic job tagging to classify and categorize jobs based on configurable rules. The tagging system consists of two components:
- Application Detection - Identifies which application a job is running by matching patterns in the job script
- Job Classification - Analyzes job performance metrics to identify performance issues or characteristics
Tags are automatically applied when jobs start or stop, and can also be applied retroactively to existing jobs. This feature is disabled by default and must be explicitly enabled in the configuration.
Enable auto-tagging
Step 1: Copy configuration files
The tagging system requires configuration files to define application patterns
and classification rules. Example configurations are provided in the cc-backend
repository at configs/tagger/.
From the cc-backend root directory, copy the configuration files to the var
directory:
mkdir -p var/tagger
cp -r configs/tagger/apps var/tagger/
cp -r configs/tagger/jobclasses var/tagger/
This copies:
- Application patterns (
var/tagger/apps/) - Text files containing regex patterns to match application names in job scripts (16 example applications) - Job classification rules (
var/tagger/jobclasses/) - JSON files defining rules to classify jobs based on metrics (3 example rules) - Shared parameters (
var/tagger/jobclasses/parameters.json) - Common threshold values used across multiple classification rules
Step 2: Enable in configuration
Add or set the enable-job-taggers configuration option in your config.json:
{
  "enable-job-taggers": true
}
Important: Automatic tagging is disabled by default. Setting this to true
activates automatic tagging for jobs that start or stop after cc-backend is
restarted.
Step 3: Restart cc-backend
The tagging system loads configuration from ./var/tagger/ at startup:
./cc-backend -server
Step 4: Verify configuration loaded
Check the logs for messages indicating successful initialization:
[INFO] Setup file watch for ./var/tagger/apps
[INFO] Setup file watch for ./var/tagger/jobclasses
These messages confirm the tagging system is active and watching for configuration changes.
How auto-tagging works
Automatic tagging
When enable-job-taggers is set to true, tags are automatically applied at
two points in the job lifecycle:
- Job Start - Application detection runs immediately when a job starts, analyzing the job script to identify the application
- Job Stop - Job classification runs when a job completes, analyzing metrics to identify performance characteristics
Note: Only jobs that start or stop after enabling the feature are automatically tagged. Existing jobs require manual tagging (see below).
Manual tagging (retroactive)
To apply tags to existing jobs in the database, use the -apply-tags command
line option:
./cc-backend -apply-tags
This processes all jobs in the database and applies current tagging rules. This is useful when:
- You have existing jobs created before tagging was enabled
- You’ve added new tagging rules and want to apply them to historical data
- You’ve modified existing rules and want to re-evaluate all jobs
The -apply-tags option works independently of the enable-job-taggers
configuration setting.
Hot reload
The tagging system watches configuration directories for changes. You can modify or add rules without restarting cc-backend:
- Changes to
var/tagger/apps/*are detected automatically - Changes to
var/tagger/jobclasses/*are detected automatically
Simply edit the files and the new rules will be applied to subsequent jobs.
Application detection
Application detection identifies which software a job is running by matching patterns in the job script.
Configuration format
Application patterns are stored in text files under var/tagger/apps/. Each
file represents one application, and the filename (without .txt extension)
becomes the tag name.
Each file contains one or more regular expression patterns, one per line:
Example: var/tagger/apps/vasp.txt
vasp
VASP
Example: var/tagger/apps/python.txt
python
pip
anaconda
conda
How it works
- When a job starts, the system retrieves the job script from metadata
- Each line in the app configuration files is treated as a regex pattern
- Patterns are matched case-insensitively against the lowercased job script
- If a match is found, a tag of type
appwith the filename as tag name is applied - Only the first matching application is tagged
Adding new applications
To add detection for a new application:
Create a new file in
var/tagger/apps/(e.g.,tensorflow.txt)Add regex patterns, one per line:
tensorflow
tf\.keras
import tensorflow
The file is automatically detected and loaded (no restart required)
The tag name will be the filename without the .txt extension (e.g.,
tensorflow).
Provided application patterns
The example configuration includes patterns for 16 common HPC applications:
- vasp
- python
- gromacs
- lammps
- openfoam
- starccm
- matlab
- julia
- cp2k
- cpmd
- chroma
- flame
- caracal
- turbomole
- orca
- alf
Job classification
Job classification analyzes completed jobs based on their metrics and properties to identify performance issues or characteristics.
Configuration format
Job classification rules are defined in JSON files under
var/tagger/jobclasses/. Each rule file contains:
- Metrics required - Which job metrics to analyze
- Requirements - Pre-conditions that must be met
- Variables - Computed values used in the rule
- Rule expression - Boolean expression that determines if the rule matches
- Hint template - Message displayed when the rule matches
Shared parameters
The file var/tagger/jobclasses/parameters.json defines threshold values used
across multiple rules:
{
  "lowcpuload_threshold_factor": 0.9,
  "excessivecpuload_threshold_factor": 1.1,
  "job_min_duration_seconds": 600.0,
  "sampling_interval_seconds": 30.0
}
These parameters can be referenced in rule expressions and make it easy to maintain consistent thresholds across multiple rules.
Rule file structure
Each classification rule is a JSON file with the following structure:
Example: var/tagger/jobclasses/lowload.json
{
  "name": "Low CPU load",
  "tag": "lowload",
  "parameters": ["lowcpuload_threshold_factor", "job_min_duration_seconds"],
  "metrics": ["cpu_load"],
  "requirements": [
    "job.shared == \"none\"",
    "job.duration > job_min_duration_seconds"
  ],
  "variables": [
    {
      "name": "load_threshold",
      "expr": "job.numCores * lowcpuload_threshold_factor"
    }
  ],
  "rule": "cpu_load.avg < cpu_load.limits.caution",
  "hint": "Average CPU load {{.cpu_load.avg}} falls below threshold {{.cpu_load.limits.caution}}"
}
Field descriptions
| Field | Description |
|---|---|
name | Human-readable description of the rule |
tag | Tag identifier applied when the rule matches |
parameters | List of parameter names from parameters.json to include in rule environment |
metrics | List of metrics required for evaluation (must be present in job data) |
requirements | Boolean expressions that must all be true for the rule to be evaluated |
variables | Named expressions computed before evaluating the main rule |
rule | Boolean expression that determines if the job matches this classification |
hint | Go template string for generating a user-visible message |
Expression environment
Expressions in requirements, variables, and rule have access to:
Job properties:
job.shared- Shared node allocation typejob.duration- Job runtime in secondsjob.numCores- Number of CPU coresjob.numNodes- Number of nodesjob.jobState- Job completion statejob.numAcc- Number of acceleratorsjob.smt- SMT setting
Metric statistics (for each metric in metrics):
<metric>.min- Minimum value<metric>.max- Maximum value<metric>.avg- Average value<metric>.limits.peak- Peak limit from cluster config<metric>.limits.normal- Normal threshold<metric>.limits.caution- Caution threshold<metric>.limits.alert- Alert threshold
Parameters:
- All parameters listed in the
parametersfield
Variables:
- All variables defined in the
variablesarray
Expression language
Rules use the expr language for expressions. Supported operations:
- Arithmetic:
+,-,*,/,%,^ - Comparison:
==,!=,<,<=,>,>= - Logical:
&&,||,! - Functions: Standard math functions (see expr documentation)
Hint templates
Hints use Go’s text/template syntax. Variables from the evaluation environment
are accessible:
{{.cpu_load.avg}}     # Access metric average
{{.job.duration}}     # Access job property
{{.load_threshold}}   # Access computed variable
Adding new classification rules
To add a new classification rule:
- Create a new JSON file in
var/tagger/jobclasses/(e.g.,memoryLeak.json) - Define the rule structure following the format above
- Add any new parameters to
parameters.jsonif needed - The file is automatically detected and loaded (no restart required)
Example: Detecting memory leaks
{
  "name": "Memory Leak Detection",
  "tag": "memory_leak",
  "parameters": ["memory_leak_slope_threshold"],
  "metrics": ["mem_used"],
  "requirements": ["job.duration > 3600"],
  "variables": [
    {
      "name": "mem_growth",
      "expr": "(mem_used.max - mem_used.min) / job.duration"
    }
  ],
  "rule": "mem_growth > memory_leak_slope_threshold",
  "hint": "Memory usage grew by {{.mem_growth}} bytes per second"
}
Don’t forget to add memory_leak_slope_threshold to parameters.json.
Provided classification rules
The example configuration includes 3 classification rules:
- lowload - Detects jobs with low CPU load (avg CPU load below caution threshold)
- excessiveload - Detects jobs with excessive CPU load (avg CPU load above peak × threshold factor)
- lowutilization - Detects jobs with low resource utilization (flop rate below alert threshold)
Troubleshooting
Tags not applied
Check tagging is enabled: Verify
enable-job-taggers: trueis set inconfig.jsonCheck configuration exists:
ls -la var/tagger/apps
ls -la var/tagger/jobclasses
Check logs for errors:
./cc-backend -server -loglevel debugVerify file permissions: Ensure cc-backend can read the configuration files
For existing jobs: Use
./cc-backend -apply-tagsto retroactively tag jobs
Rules not matching
Enable debug logging: Set log level to debug to see detailed rule evaluation:
./cc-backend -server -loglevel debugCheck requirements: Ensure all requirements in the rule are satisfied
Verify metrics exist: Classification rules require job metrics to be available in the job data
Check metric names: Ensure metric names in rules match those in your cluster configuration
File watch not working
If changes to configuration files aren’t detected automatically:
- Restart cc-backend to reload all configuration
- Check filesystem supports file watching (some network filesystems may not support inotify)
- Check logs for file watch setup messages
Best practices
- Start simple: Begin with basic rules and refine based on results
- Use requirements: Filter out irrelevant jobs early with requirements to avoid unnecessary metric processing
- Test incrementally: Add one rule at a time and verify behavior before adding more
- Document rules: Use descriptive names and clear hint messages
- Share parameters: Define common thresholds in
parameters.jsonfor consistency - Version control: Keep your
var/tagger/configuration in version control to track changes - Backup before changes: Test new rules on a development instance before deploying to production
Tag types and usage
The tagging system creates two types of tags:
app- Application tags (e.g., “vasp”, “gromacs”, “python”)jobClass- Classification tags (e.g., “lowload”, “excessiveload”, “lowutilization”)
Tags can be:
- Queried and filtered in the ClusterCockpit UI
- Used in API queries to find jobs with specific characteristics
- Referenced in reports and analytics
Tags are stored in the database and appear in the job details view, making it easy to identify application usage and performance patterns across your cluster.
5.12 - How to generate JWT tokens
Overview
ClusterCockpit uses JSON Web Tokens (JWT) for authorization of its APIs. JWTs are the industry standard for securing APIs and is also used for example in OAuth2. For details on JWTs refer to the JWT article in the Concepts section.
JWT tokens for cc-backend login and REST API
When a user logs in via the /login page using a browser, a session cookie
(secured using the random bytes in the SESSION_KEY env variable you should
change as well in production) is used for all requests after the successful
login. The JWTs make it easier to use the APIs of ClusterCockpit using scripts
or other external programs. The token is specified n the Authorization HTTP
header using the Bearer schema
(there is an example below). Tokens can be issued to users from the
configuration view in the Web-UI or the command line (using the -jwt <username> option). In order to use the token for API endpoints such as
/api/jobs/start_job/, the user that executes it needs to have the api role.
Regular users can only perform read-only queries and only look at data connected
to jobs they started themselves.
There are two usage scenarios:
- The APIs are used during a browser session. API accesses are authorized with the active session.
- The REST API is used outside a browser session, e.g. by scripts. In this case
you have to issue a token manually. This possible from within the
configuration view or on the command line. It is recommended to issue a JWT
token in this case for a special user that only has the
apirole. By using different users for different purposes a fine grained access control and access revocation management is possible.
The token is commonly specified in the Authorization HTTP header using the
Bearer schema. ClusterCockpit uses a ECDSA private/public keypair to sign and
verify its tokens. You can use cc-backend to generate new JWT tokens.
Create a new ECDSA Public/private key pair for signing and validating tokens
We provide a small utility tool as part of cc-backend:
go build ./cmd/gen-keypair/
./gen-keypair
Add key pair in your .env file for cc-backend
An env file template can be found in ./configs.
cc-backend requires the private key to sign newly generated JWT tokens and the
public key to validate tokens used to authenticate in its REST APIs.
Generate new JWT token
Every user with the admin role can create or change a user in the configuration view of the web interface. To generate a new JWT for a user just press the GenJWT button behind the user name in the user list.
A new api user and corresponding JWT keys can also be generated from the command line.
Create new API user with admin and api role:
./cc-backend -add-user myapiuser:admin,api:<password>
Create a new JWT token for this user:
./cc-backend -jwt myapiuser
Use issued token token on client side
curl -X GET "<API ENDPOINT>" -H "accept: application/json" -H "Content-Type: application/json" -H "Authorization: Bearer <JWT TOKEN>"
This token can be used for the cc-backend REST API as well as for the
cc-metric-store. If you use the token for cc-metric-store you have to
configure it to use the corresponding public key for validation in its
config.json.
Note
Per default the JWT tokens generated by cc-backend will not expire! To set an expiration date you have to configure an expiration duration inconfig.json.
You find details here,
use keys jwts:max-age.Of course the JWT token can be generated also by other means as long it is
signed with a ED25519 private key and the corresponding public key is configured
in cc-backend or cc-metric-store. For the claims that are set and used by
ClusterCockpit refer to the JWT article.
cc-metric-store
The cc-metric-store also
uses JWTs for authentication. As it does not issue new tokens, it does not need
to know the private key. The public key of the keypair that is used to generate
the JWTs that grant access to the cc-metric-store can be specified in its
config.json. When configuring the metricDataRepository object in the
cluster.json file of the job-archive, you can put a token issued by
cc-backend itself.
Other tools to generate signed tokens
The golang-jwt project provides a small command line tool to sign and verify tokens. You can install it with:
go install github.com/golang-jwt/jwt/v5/cmd/jwt
OpenSSL can be used to generate ED25519 key-pairs:
# Generate ed25519 private key
openssl genpkey -algorithm ed25519 -out privkey.pem
# export its public key
openssl pkey -in privkey.pem -pubout -out pubkey.pem
5.13 - How to plan and configure resampling
Enable timeseries resampling
ClusterCockpit now supports resampling of time series data to a lower frequency. This dramatically improves load times for very large or very long jobs, and we recommend enabling it. Resampling is supported for running as well as for finished jobs.
Note: For running jobs, this currently only works with the newest version of
cc-metric-store. Resampling support for the Prometheus time series database will be added in the future.
Resampling Algorithm
To preserve visual accuracy while reducing data points, ClusterCockpit utilizes the Largest-Triangle-Three-Buckets (LTTB) algorithm.
Standard downsampling methods often fail to represent data accurately:
- Averaging: Tends to smooth out important peaks and valleys, hiding critical performance spikes.
- Decimation (Step sampling): Simply skips points, which can lead to random data loss and missed outliers.
In contrast, LTTB uses a geometric approach to select data points that form the largest triangles effectively. This technique creates a downsampled representation that retains the perceptual shape of the original line graph, ensuring that significant extrema and performance trends remain visible even at lower resolutions.
Configuration
To enable resampling, you must add the following toplevel configuration key:
"resampling": {
  "minimum-points": 300,
  "trigger": 30,
  "resolutions": [
    600,
    300,
    120,
    60
  ]
}
Configuration Parameters
The enable-resampling object is optional. If configured, it enables dynamic downsampling of metric data using the following properties:
minimum-points(Integer) Specifies the minimum number of data points required to trigger resampling. This ensures short jobs are not unnecessarily downsampled.- Example: If
minimum-pointsis set to300and if the native frequency is 60 seconds, resampling will only trigger for jobs longer than 10 hours (300 points * 60 seconds = 18,000 seconds / 3600 = 5 hours).
- Example: If
resolutions(Array [Integer]) An array of target resampling resolutions in seconds.- Example:
[600, 300, 120, 60] - Note: The finest resolution in this list must match the native resolution of your metrics. If you have different native resolutions across your metric configuration, you should use the finest available resolution here. The implementation will automatically fallback to the finest available resolution if an exact match isn’t found.
- Example:
trigger(Integer) Controls the zoom behavior. It specifies the threshold of visible data points required to trigger the next zoom level. When the number of visible points in the plot window drops below this value (due to zooming in), the backend loads the next finer resolution level.
Example view of resampling in graphs
The following examples demonstrate how the configuration above (minimum-points: 300, trigger: 30) affects the visualization of a 16-hour job.
1. Initial Overview (Coarse Resolution)
Because the job duration (~16 hours) requires more than 300 points at native resolution, the system automatically loads the 600s resolution. This provides a fast “overview” load without fetching high-frequency data. You can see in the tooltip of this example that we see datapoints every 10 minutes (because of frequency of 600).
2. Zooming without Triggering
When the user zooms in, the system checks if the number of visible data points in the new view is less than the trigger value (30). In the example below, the zoomed window still contains enough points, so the resolution remains at 600s. As you can see from the tooltip of the example, we still see dataa points every 10 mins.
3. Zooming and Triggering Detail
As the user zooms in deeper, the number of visible points drops below the trigger threshold of 30. This signals the backend to fetch the next finer resolution (e.g., 120s or 60s). The graph updates dynamically to show the high-frequency peaks that were previously smoothed out. As you can see from the tooltip of the example, the backend has detected that the selected data points are below trigger threshold and load the second last resampling level with the frequency of 120. With native frequency of 60, a frequency of 120 means 2 mins of data. We will see data points every 2 mins as seen in the tooltip of the example.
4. Visual Comparison
The animation below highlights the difference in visual density and performance between the raw data and the optimized resampled view. As you know the minimum-points is 300, means resampling will trigger only for jobs > 5 hours of duration (assuming native frequency of 60).
Suggestion on configuring the resampling
Based on the experiments we have done and the performance we have observed, we recommend the reader to:
- configure the
"minimum-points": 900. This means, assuming native frequency of 60, resampling will trigger for jobs > 15 hours of duration. - configure the
"resolutions"with 2 or 3 levels only, with the last level being native frequency. A resampling frequency of 600 is only recommended for jobs > 24 hours of duration.
5.14 - How to regenerate the Swagger UI documentation
Overview
This project integrates swagger ui to
document and test its REST API. The swagger documentation files can be found in
./api/.
Note
To regenerate the Swagger UI files is only required if you change the files./internal/api/rest.go. Otherwise the Swagger UI will already be correctly
build and is ready to use.Generate Swagger UI files
You can generate the swagger-ui configuration by running the following command from the cc-backend root directory:
go run github.com/swaggo/swag/cmd/swag init -d ./internal/api,./pkg/schema -g rest.go -o ./api
You need to move one generated file:
mv ./api/docs.go ./internal/api/docs.go
Finally rebuild cc-backend:
make
Use the Swagger UI web interface
If you start cc-backend with the -dev flag, the Swagger web interface is available
at http://localhost:8080/swagger/.
To use the Try Out functionality, e.g. to test the REST API, you must enter a JWT
key for a user with the API role.
Info
The user who owns the JWT key must not be logged into the same browser (have a valid session), or the Swagger requests will not work. It is recommended to create a separate user that has only the API role.5.15 - How to setup a systemd service
How to run as a systemd service.
The files in this directory assume that you install ClusterCockpit to
/opt/monitoring/cc-backend.
Of course you can choose any other location, but make sure you replace all paths
starting with /opt/monitoring/cc-backend in the clustercockpit.service file!
The config.json may contain the optional fields user and group. If
specified, the application will call
setuid and
setgid after reading the
config file and binding to a TCP port (so it can take a privileged port), but
before it starts accepting any connections. This is good for security, but also
means that the var/ directory must be readable and writeable by this user.
The .env and config.json files may contain secrets and should not be
readable by this user. If these files are changed, the server must be restarted.
- Clone this repository somewhere in your home
git clone git@github.com:ClusterCockpit/cc-backend.git
- (Optional) Install dependencies and build. In general it is recommended to use the provided release binaries.
cd cc-backend && make
Copy the binary to the target folder (adapt if necessary):
sudo mkdir -p /opt/monitoring/cc-backend/
cp ./cc-backend /opt/monitoring/cc-backend/
- Modify the
config.jsonandenv-template.txtfile from theconfigsdirectory to your liking and put it in the target directory
cp ./configs/config.json /opt/monitoring/config.json && cp ./configs/env-template.txt /opt/monitoring/.env
vim /opt/monitoring/config.json # do your thing...
vim /opt/monitoring/.env # do your thing...
- (Optional) Customization: Add your versions of the login view, legal texts, and logo image. You may use the templates in
./web/templatesas blueprint. Every overwrite is separate.
cp login.tmpl /opt/monitoring/cc-backend/var/
cp imprint.tmpl /opt/monitoring/cc-backend/var/
cp privacy.tmpl /opt/monitoring/cc-backend/var/
# Ensure your logo, and any images you use in your login template has a suitable size.
cp -R img /opt/monitoring/cc-backend/img
- Copy the systemd service unit file. You may adopt it to your needs.
sudo cp ./init/clustercockpit.service /etc/systemd/system/clustercockpit.service
- Enable and start the server
sudo systemctl enable clustercockpit.service # optional (if done, (re-)starts automatically)
sudo systemctl start clustercockpit.service
Check whats going on:
sudo systemctl status clustercockpit.service
sudo journalctl -u clustercockpit.service
5.16 - How to use the REST API Endpoints
Overview
ClusterCockpit offers several REST API Endpoints. While some are integral part of the ClusterCockpit-Stack Workflow (such asstart_job), others are optional.
These optional endpoints supplement the functionality of the webinterface with information reachable from scripts or the command line. For example, job metrics could be requested for specific jobs and handled in external statistics programs.
All of the endpoints listed for both administrators and users are secured by JWT authentication. As such, all prerequisites applicable to JSON Web Tokens apply in this case as well, e.g. private and public key setup.
See also the Swagger Reference for more detailed information on each endpoint and the payloads.
Admin Accessible REST API
Admin API Prerequisites
- JWT has to be generated by either a dedicated API user (has only
apirole) or by an administrator with bothadminandapiroles. - JWTs have a limited lifetime, i.e. will become invalid after a configurable amount of time (see
auth.jwt.max-ageconfig option). - Administrator endpoints are additionally subjected to a configurable IP whitelist (see
api-allowed-ipsconfig option). Per default there is no restriction on IPs that can access the endpoints.
Admin API Endpoints and Functions
| Endpoint | Method | Request Payload(s) | Description |
|---|---|---|---|
/api/users/ | GET | - | Lists all Users |
/api/clusters/ | GET | - | Lists all Clusters |
/api/tags/ | DELETE | JSON Payload | Removes payload array of tags specified with Type, Name, Scope from DB. Private Tags cannot be removed. |
/api/jobs/start_job/ | POST, PUT | JSON Payload | Starts Job |
/api/jobs/stop_job/ | POST, PUT | JSON Payload | Stops Jobs |
/api/jobs/ | GET | URL-Query Params | Lists Jobs |
/api/jobs/{id} | POST | $id, JSON Payload | Loads specified job metadata |
/api/jobs/{id} | GET | $id | Loads specified job with metrics |
/api/jobs/tag_job/{id} | POST, PATCH | $id, JSON Payload | Adds payload array of tags specified with Type, Name, Scope to Job with $id. Tags are created in BD. |
/api/jobs/tag_job/{id} | POST, PATCH | $id, JSON Payload | Removes payload array of tags specified with Type, Name, Scope from Job with $id. Tags remain in DB. |
/api/jobs/edit_meta/{id} | POST, PATCH | $id, JSON Payload | Edits meta_data db colums info |
/api/jobs/metrics/{id} | GET | $id, URL-Query Params | Loads specified jobmetrics for metric and scope params |
/api/jobs/delete_job/ | DELETE | JSON Payload | Deletes job specified in payload |
/api/jobs/delete_job/{id} | DELETE | $id, JSON Payload | Deletes job specified by db id |
/api/jobs/delete_job_before/{ts} | DELETE | $ts | Deletes all jobs before specified unix timestamp |
User Accessible REST API
User API Prerequisites
- JWT has to be generated by either a dedicated API user (Has only
apirole) or an User with additionalapirole. - JWTs have a limited lifetime, i.e. will become invalid after a configurable amount of time (see
jwt.max-ageconfig option).
User API Endpoints and Functions
| Endpoint | Method | Request | Description |
|---|---|---|---|
/userapi/jobs/ | GET | URL-Query Params | Lists Jobs |
/userapi/jobs/{id} | POST | $id, JSON Payload | Loads specified job metadata |
/userapi/jobs/{id} | GET | $id | Loads specified job with metrics |
/userapi/jobs/metrics/{id} | GET | $id, URL-Query Params | Loads specified jobmetrics for metric and scope params |
5.17 - How to use the Swagger UI documentation
Overview
This project integrates swagger ui to
document and test its REST API.
./api/.
Access the Swagger UI web interface
If you start cc-backend with the -dev flag, the Swagger web interface is available
at http://localhost:8080/swagger/.
To use the Try Out functionality, e.g. to test the REST API, you must enter a JWT
key for a user with the API role.
Info
The user who owns the JWT key must not be logged into the same browser (have a valid session), or the Swagger requests will not work. It is recommended to create a separate user that has only the API role.6 - Explanation
6.1 - Authentication
Overview
The authentication is implemented in internal/auth/. In auth.go
an interface is defined that any authentication provider must fulfill. It also
acts as a dispatcher to delegate the calls to the available authentication
providers.
Two authentication types are available:
- JWT authentication for the REST API that does not create a session cookie
- Session based authentication using a session cookie
The most important routines in auth are:
Login()Handle POST request to login user and start a new sessionAuth()Authenticate user and put User Object in context of the request
The http router calls auth in the following cases:
r.Handle("/login", authentication.Login( ... )).Methods(http.MethodPost): The POST request on the/loginroute will call the Login callback.r.Handle("/jwt-login", authentication.Login( ... )): Any request on the/jwt-loginroute will call the Login callback. Intended for use for the JWT token based authenticators.- Any route in the secured subrouter will always call Auth(), on success it will call the next handler in the chain, on failure it will render the login template.
secured.Use(func(next http.Handler) http.Handler {
  return authentication.Auth(
    // On success;
    next,

    // On failure:
    func(rw http.ResponseWriter, r *http.Request, err error) {
               // Render login form
    })
})
A JWT token can be used to initiate an authenticated user session. This can either happen by calling the login route with a token provided in a header or via a special cookie containing the JWT token. For API routes the access is authenticated on every request using the JWT token and no session is initiated.
Login
The Login function (located in auth.go):
- Extracts the user name and gets the user from the user database table. In case the user is not found the user object is set to nil.
- Iterates over all authenticators and:
- Calls its
CanLoginfunction which checks if the authentication method is supported for this user. - Calls its
Loginfunction to authenticate the user. On success a valid user object is returned. - Creates a new session object, stores the user attributes in the session and saves the session.
- Starts the
onSuccesshttp handler
- Calls its
Local authenticator
This authenticator is applied if
return user != nil && user.AuthSource == AuthViaLocalPassword
Compares the password provided by the login form to the password hash stored in the user database table:
if e := bcrypt.CompareHashAndPassword([]byte(user.Password), []byte(r.FormValue("password"))); e != nil {
  log.Errorf("AUTH/LOCAL > Authentication for user %s failed!", user.Username)
  return nil, fmt.Errorf("Authentication failed")
}
LDAP authenticator
This authenticator is applied if the user was found in the database and its AuthSource is LDAP:
if user != nil {
  if user.AuthSource == schema.AuthViaLDAP {
    return user, true
  }
}
If the option SyncUserOnLogin is set it tried to sync the user from the LDAP
directory. In case this succeeds the user is persisted to the database and can
login.
Gets the LDAP connection and tries a bind with the provided credentials:
if err := l.Bind(userDn, r.FormValue("password")); err != nil {
  log.Errorf("AUTH/LDAP > Authentication for user %s failed: %v", user.Username, err)
  return nil, fmt.Errorf("Authentication failed")
}
JWT Session authenticator
Login via JWT token will create a session without password.
For login the X-Auth-Token header is not supported. This authenticator is
applied if the Authorization header or query parameter login-token is present:
  return user, r.Header.Get("Authorization") != "" ||
    r.URL.Query().Get("login-token") != ""
The Login function:
- Parses the token and checks if it is expired
- Check if the signing method is EdDSA or HS256 or HS512
- Check if claims are valid and extracts the claims
- The following claims have to be present:
sub: The subject, in this case this is the usernameexp: Expiration in Unix epoch timeroles: String array with roles of user
- In case user does not exist in the database and the option
SyncUserOnLoginis set add user to user database table withAuthViaTokenAuthSource. - Return valid user object
JWT Cookie Session authenticator
Login via JWT cookie token will create a session without password. It is first checked if the required configuration options are set:
trustedIssuerCookieName
The environment variable CROSS_LOGIN_JWT_PUBLIC_KEY is required as well:
It is used to verify the identity of the trustedIssuer.
The public key must match accordingly.
This authenticator is applied if the configured cookie is present:
  jwtCookie, err := r.Cookie(cookieName)

  if err == nil && jwtCookie.Value != "" {
    return true
  }
The Login function:
- Extracts and parses the token
- Checks if signing method is Ed25519/EdDSA
- In case publicKeyCrossLogin is configured:
- Check if
ississuer claim matched trusted issuer from configuration - Return public cross login key
- Otherwise return standard public key
- Check if
- Check if claims are valid
- Depending on the option
validateUserthe roles are extracted from JWT token or taken from user object fetched from database - Ask browser to delete the JWT cookie
- In case user does not exist in the database and the option
SyncUserOnLoginis set add user to user database table withAuthViaTokenAuthSource. - Return valid user object
Auth
The Auth function (located in auth.go):
- Returns a new http handler function that is defined right away
- This handler tries two methods to authenticate a user:
- Via a JWT API token in
AuthViaJWT() - Via a valid session in
AuthViaSession()
- Via a JWT API token in
- If err is not nil and the user object is valid it puts the user object in the request context and starts the onSuccess http handler
- Otherwise it calls the onFailure handler
AuthViaJWT
Implemented in JWTAuthenticator:
- Extract token either from header
X-Auth-TokenorAuthorizationwith Bearer prefix - Parse token and check if it is valid. The Parse routine will also check if the token is expired.
- If the option
validateUseris set it will ensure the user object exists in the database and takes the roles from the database user - Otherwise the roles are extracted from the roles claim
- Returns a valid user object with AuthType set to AuthToken
AuthViaSession
- Extracts session
- Get values username, projects, and roles from session
- Returns a valid user object with AuthType set to AuthSession
6.2 - Configuration Management
Release versions
Versions are marked according to semantic versioning. Each version embeds the following static assets in the binary:
- Web frontend with javascript files and all static assets
- Golang template files for server-side rendering
- JSON schema files for validation
- Database migration files
The remaining external assets are:
- The SQL database used
- The job archive
- The configuration files
config.jsonand.env
The external assets are versioned with integer IDs.
This means that each release binary is bound to specific versions of the SQL
database and the job archive.
The configuration file is checked against the current schema at startup.
The -migrate-db command line switch can be used to migrate the SQL database
from a previous version to the latest one.
We offer a separate tool archive-migration to migrate an existing job archive
from the previous to the latest version.
Versioning of APIs
cc-backend provides two API backends:
- A REST API for querying jobs.
- A GraphQL API for data exchange between web frontend and cc-backend.
The REST API will also be versioned. We still have to decide whether we will also support older REST API versions by versioning the endpoint URLs. The GraphQL API is for internal use and will not be versioned.
How to build
In general it is recommended to use the provided release binary.
In case you want to build build cc-backend please always use the provided makefile. This will ensure
that the frontend is also built correctly and that the version in the binary is encoded in the binary.
6.3 - InfluxDB Line Protocol
Overview
All metrics ingested into the cc-metric-store—whether via REST API or NATS—must strictly adhere to the InfluxDB Line Protocol. This text-based format allows us to tag high-frequency telemetry data with the necessary dimensions (cluster, host, hardware type) for efficient querying.
Line Protocol Syntax
The general format for a single data point is:
<measurement>,<tag_set> <field_set> <timestamp>
In our specific cc-metric-store implementation, the structure translates to:
metric_name,cluster=<name>,hostname=<host>,type=<hw_type>,type-id=<id> value=<float> <unix_epoch>
| Component | Description | Example |
|---|---|---|
| Measurement | The specific metric name being recorded. | cpu_load |
| Tags | Key-value pairs providing context (metadata). | cluster=alex,hostname=node01 |
| Fields | The actual data value. We use a single field key: value. | value=45.2 |
| Timestamp | Unix timestamp in seconds. | 1725827464 |
Metric Modes
We distinguishes between two primary scopes of metrics: Hardware Level and Node Level.
1. Hardware Level Metrics
These metrics track the performance of specific sub-components within a node (e.g., a specific CPU core, a GPU, or a memory domain).
Requirement: You must include the type-id tag to distinguish between multiple components of the same type on the same host.
Schema:
<metric>,cluster=<c>,hostname=<h>,type=<component>,type-id=<index> value=<v> <time>
Example Hardware Types:
hwthread: Logical CPU threads. (IDs:0..127for Cluster1,0..71for Cluster2)socket: Physical CPU sockets. (IDs:0..1)accelerator: GPUs or FPGA cards. (IDs: PCI Bus Address, e.g.,00000000:49:00.0)memoryDomain: NUMA nodes. (IDs:0..7)
Example Payload:
cpu_user,cluster=alex,hostname=a0603,type=hwthread,type-id=12 value=88.5 1725827464
core_power,cluster=fritz,hostname=f0201,type=socket,type-id=0 value=120.0 1725827464
2. Node Level Metrics
These metrics represent the aggregate state of the entire node.
Requirement: The type tag is set to node. The type-id tag is usually omitted or ignored for these metrics.
Schema:
<metric>,cluster=<c>,hostname=<h>,type=node value=<v> <time>
Example Payload:
mem_used,cluster=alex,hostname=a0603,type=node value=64000.0 1725827464
ib_xmit,cluster=fritz,hostname=f0201,type=node value=1024500.0 1725827464
Related Tools
To test this protocol with synthetic data, you can use the Metric Generator. See the documentation here: Metric Generator Script
6.4 - JSON Web Token
Introduction
ClusterCockpit uses JSON Web Tokens (JWT) for
authorization of its APIs. JSON Web Token (JWT) is an open standard (RFC 7519)
that defines a compact and self-contained way for securely transmitting
information between parties as a JSON object. This information can be verified
and trusted because it is digitally signed. In ClusterCockpit JWTs are signed
using a public/private key pair using ECDSA. Because tokens are signed using
public/private key pairs, the signature also certifies that only the party
holding the private key is the one that signed it. Expiration of the generated
tokens as well as the maximum length of a browser session can be configured in
the config.json file described
here.
The Ed25519 algorithm for signatures was used because it is compatible with other tools that require authentication, such as NATS.io, and because these elliptic-curve methods provide simillar security with smaller keys compared to something like RSA. They are sligthly more expensive to validate, but that effect is negligible.
JWT Payload
You may view the payload of a JWT token at https://jwt.io/#debugger-io. Currently ClusterCockpit sets the following claims:
iat: Issued at claim. The “iat” claim is used to identify the the time at which the JWT was issued. This claim can be used to determine the age of the JWT.sub: Subject claim. Identifies the subject of the JWT, in our case this is the username.roles: An array of strings specifying the roles set for the subject.exp: Expiration date of the token (only if explicitly configured)
It is important to know that JWTs are not encrypted, only signed. This means that outsiders cannot create new JWTs or modify existing ones, but they are able to read out the username.
Accept externally generated JWTs provided via cookie
If there is an external service like an AuthAPI that can generate JWTs and hand them over to ClusterCockpit via cookies, CC can be configured to accept them:
.env: CC needs a public ed25519 key to verify foreign JWT signatures. Public keys in PEM format can be converted with the instructions in /tools/convert-pem-pubkey-for-cc .
CROSS_LOGIN_JWT_PUBLIC_KEY="+51iXX8BdLFocrppRxIw52xCOf8xFSH/eNilN5IHVGc="
config.json: Insert a name for the cookie (set by the external service) containing the JWT so that CC knows where to look at. Define a trusted issuer (JWT claim ‘iss’), otherwise it will be rejected. If you want usernames and user roles from JWTs (‘sub’ and ‘roles’ claim) to be validated against CC’s internal database, you need to enable it here. Unknown users will then be rejected and roles set via JWT will be ignored.
"jwts": {
    "cookieName": "access_cc",
    "forceJWTValidationViaDatabase": true,
    "trustedExternalIssuer": "auth.example.com"
}
- Make sure your external service includes the same issuer (
iss) in its JWTs. Example JWT payload:
{
  "iat": 1668161471,
  "nbf": 1668161471,
  "exp": 1668161531,
  "sub": "alice",
  "roles": ["user"],
  "jti": "a1b2c3d4-1234-5678-abcd-a1b2c3d4e5f6",
  "iss": "auth.example.com"
}
6.5 - Metric Store
Introduction
CCMS (Cluster Cockpit Metric Store) is a simple in-memory time series database. It stores the data about the nodes in your cluster for a specific interval of days. Data about your nodes can be collected with various instrumentation tools like RAPL, LIKWID, PAPI etc. Instrumentation tools can collect data like memory bandwidth, flops, clock frequency, CPU usage etc. After a specified number of days, the data from the in-memory database will be written to disk, archived and released from the in-memory database. In this documentation, we will explain in-detail working of the CCMS components and the outline of the documentation is as follows:
- Present the structure of the metric store.
- Explain background workers.
Let us get started with the very basic understanding of how CCMS is structured and how it manages data over time.
General tree structure can be as follows:
root
|-----cluster
| |------node -> [node-metrics]
| |  |--components -> [node-level-metrics]
| |  |--components -> [node-level-metrics]
| |
| |------node -> [node-metrics]
|   |--components -> [node-level-metrics]
|   |--components -> [node-level-metrics]
|
|-----cluster
 |-----node -> [node-metrics]
 | |--components -> [node-level-metrics]
 | |--components -> [node-level-metrics]
 |
 |-----node -> [node-metrics]
  |--components -> [node-level-metrics]
  |--components -> [node-level-metrics]
A simple tree representation with example:
root
|-----alex
| |------a903 -> [mem_cached,cpu_idle,nfs4_read]
| |  |--hwthread01 -> [cpu_load,cpu_user,flops_any]
| |  |--accelerator01 -> [mem_bw,mem_used,flops_any]
| |
| |------a322 -> [mem_cached,cpu_idle,nfs4_read]
|   |--hwthread42 -> [cpu_load,cpu_user,flops_any]
|   |--accelerator05 -> [mem_bw,mem_used,flops_any]
|
|-----fritz
 |-----f104 -> [mem_cached,cpu_idle,nfs4_read]
 | |--hwthread35 -> [cpu_load,cpu_user,flops_any]
 | |--socket02 -> [cpu_load,cpu_user,flops_any]
 |
 |-----f576 -> [mem_cached,cpu_idle,nfs4_read]
  |--hwthread47 -> [cpu_load,cpu_user,flops_any]
  |--cpu01 -> [cpu_load,cpu_user,flops_any]
Example tree structure of CCMS containing 2 clusters ‘alex’ and ‘fritz’ that contains each of its own nodes and each node contains its components. Each node and its component contains metrics. a903 is an example of a node and hwthread01 & accelerator01 is a node-level component. Each node will have its own metrics as well as node-level components will also have their own metrics i.e. node-level-metrics.

Internal data structures used in cc-metric-store
A representation of the Level and Buffer data structure with the buffer chain.

From our previous example, we move from a simplistic view to a more realistic view. Each buffer for the given metric holds up to BUFFER_CAP elements in its data array. Usually the BUFFER_CAP is 512 elements, so for float64 elements, the buffer size is 4KB, which is also the size of the page in general. Below you can find all the data structures and its associated member variables. In our example, the start time in buffer is exactly 512 epoch seconds apart. Older buffers are pushed to the previous of the new buffer. This creates a chain of buffers for every level.
Data structure used to hold the data in memory:
- MemoryStore
MemoryStore struct {
    // Parses and stores the metrics from config.json
    Metrics HashMap[string][MetricConfig]

    // Initial root level.
    root    Level
}
- Level
// From our example, alex, fritz, a903, a322, hwthreads01 are all of Level data stucture.
Level struct {
    // Stores the metrics for the level.
    // From our example, mem_cached, flops_any are of Buffer data structure.
    metrics  []*buffer

    // Stores
    children HashMap[string][*Level]
}
- Buffer
buffer struct {
    // Pointer to previous buffer
    prev      *buffer

    // Pointer to next buffer
    next      *buffer

    // Array of floats to store

    // Interval in seconds at which measurements will arive.
    frequency int64

    // Buffer's start time stored in epoch seconds
    start     int

    // If true, this buffer will be skipped for file checkpointing
    archived  bool

    closed    bool
}
- MetricConfig
MetricConfig struct {
    // Interval in seconds at which measurements will arive.
    // frequency of 60 means the the timestep/resolution is 60 seconds.
    Frequency     int

    // Can be 'sum', 'avg' or null. Describes how to aggregate metrics from the same timestep over the hierarchy.
    Aggregation   String

    // Private, used internally...
    Offset        int
}
Background workers
Background workers are separate threads spawned for each background task like:
Data retention -> This background worker uses
retention-on-memoryparameter in theconfig.jsonand sets a looping interval for the user-given time. It ticks until the given interval is reached and then releases all the Buffers in CCMS which are less than the user-given time.
In this example, we assume that we insert data continuously in CCMS with retention period of 48 hrs. So the background worker will always check with an interval of retention-period/2. In the example, it is necessary to check every 24 hrs so that the CCMS can retain data of 48 hrs overall. Once it reaches 72 hrs, background worker releases the first 24 hours of data from the in-memory database.
Note: We have a dynamic buffer retention feature when using the internal cc-metric-store. Meaning the buffers for jobs running for more than the retention-in-memory duration will be kept in the metric-store. Once the jobs complete, the retained buffers will be freed during next retention cycle.
Data checkpointing-> This background worker usesintervalfrom thecheckpointsparameter in theconfig.jsonand sets a looping interval for the user-given time. It ticks until the given interval is reached and creates local backups of the data from the CCMS to the disk. The check pointed files can be found at the user-defineddirectorysub-parameter from thecheckpointsparameter in theconfig.jsonfile. Check pointing does not mean removing the data from the in-memory database. The data from the memory will only be released until retention period is reached.Data cleaning-> We have 2 modes of data cleanup. Meaning that the checkpoint files from the checkpoint directory will either be deleted or archived. This background worker usesintervalfrom thecleanupparameter in theconfig.jsonand sets a looping interval for the user-given time. It ticks until the given interval is reached and zips all the checkpointed files which are before the user-given time in theintervalsub-parameter. Once the checkpointed files are zipped, they are deleted from the checkpointing directory. If nointervalis specified, then it ba default uses theretention-in-memoryduration. If nocleanupsection is specified, then the default mode is delete mode.Memory-usage tracker-> We have a worker that tracks the memory-usage of the CCMS. This worker tracks the memory usage every 1 hour. It just calculates the size of CCMS based on number of buffers and the length of the buffers. This worker depends on thememory-capvalue from theconfig.json. Once the memory-usage of CCMS reaches above thememory-capvalue, it will first free the dynamically retained buffers for longer running jobs. If the memory-usage is still higher than the limit, it will free the last buffer for every level present within the metric-store.Graceful shutdown handler-> This is a special background worker that detects system or keyboard interrupts like Ctrl+C or Ctrl+Z. In case of an interrupt, it is essential to save the data from the in-memory database. There can be a case when the CCMS contains data just in the memory and it has not been checkpointed. So this background worker scans for the Buffers that have not been checkpointed and writes them to the checkpoint files before shutting down the CCMS.
Reusing the buffers in cc-metric-store
This section explain how CCMS handles the buffer re usability once the buffers are released by the retention background worker.

In this example, we extend the previous example and assume that the retention background worker releases every last buffer from each level i.e. node and node-level metrics. Each buffer that is about to be unlinked from the buffer chain will not be freed from memory, but instead will be unlinked and stored in the memory pool as shown. This allow buffer reusability whenever the buffers reaches the BUFFER_CAP limit and each metric requests new buffers.
6.6 - NATS messaging
Introduction
NATS is a powerful messaging solution supporting many paradigms. Since it is itself implemented in Golang it provides excellent support for Golang based applications. Currently NATS is offered in most ClusterCockpit applications as an alternative to the default REST API. We plan to make NATS the default way to communicate within the ClusterCockpit framework in the future.
Advantages for us to use NATS:
- Scalable and low overhead messaging infrastructure
- Flexible configuration free setup of message sources and consumers
- Builtin zero trust JWT-based authentication system
- Simple message filtering based on hierarchical subject names
- Multicast and message queue support
NATS API
When api-subjects is configured in the main section of config.json,
cc-backend subscribes to the specified NATS subjects for job events and node
state updates. This replaces the REST API endpoints for start_job and
stop_job – those REST endpoints are automatically disabled when NATS subjects
are configured.
Message Format
All NATS messages use InfluxDB line protocol format:
measurement,tag1=value1,tag2=value2 field1=value1 timestamp
Job Events
Job start/stop events use the job measurement with a function tag:
Start a job:
job,function=start_job event="{\"jobId\":1001,\"user\":\"testuser\",\"cluster\":\"fritz\",\"subCluster\":\"spr\",\"partition\":\"normal\",\"project\":\"myproject\",\"numNodes\":2,\"numHwthreads\":128,\"numAcc\":0,\"exclusive\":1,\"walltime\":86400,\"resources\":[{\"hostname\":\"node01\"},{\"hostname\":\"node02\"}],\"startTime\":1234567890}" 1234567890000000000
Stop a job:
job,function=stop_job event="{\"jobId\":1001,\"cluster\":\"fritz\",\"stopTime\":1234569000,\"state\":\"completed\"}" 1234569000000000000
The JSON payload in the event field follows the schema.Job structure for
start events and the StopJobAPIRequest structure for stop events.
Node State Events
Node state updates use the nodestate measurement:
nodestate event="{\"cluster\":\"fritz\",\"nodes\":[{\"hostname\":\"node01\",\"states\":[\"idle\"],\"cpusAllocated\":0,\"memoryAllocated\":0,\"gpusAllocated\":0,\"jobsRunning\":0},{\"hostname\":\"node02\",\"states\":[\"allocated\"],\"cpusAllocated\":128,\"memoryAllocated\":256000,\"gpusAllocated\":4,\"jobsRunning\":1}]}" 1234567890000000000
Each node entry in the nodes array supports the following fields:
| Field | Type | Description |
|---|---|---|
hostname | string | Node hostname |
states | []string | Scheduler state strings (allocated, idle, down, mixed, reserved) |
cpusAllocated | integer | Number of allocated CPUs |
memoryAllocated | integer | Allocated memory in MB |
gpusAllocated | integer | Number of allocated GPUs |
jobsRunning | integer | Number of running jobs |
Configuration
To enable the NATS API, configure both the nats and api-subjects sections:
{
  "main": {
    "api-subjects": {
      "subject-job-event": "cc.job.event",
      "subject-node-state": "cc.node.state"
    }
  },
  "nats": {
    "address": "nats://localhost:4222",
    "username": "root",
    "password": "root"
  }
}
Authentication
NATS provides a sophisticated authentication scheme based on JWT tokens and NKeys. It provides the nsc tool to create and manage tokens supporting fine grained authentication and authorization control.
6.7 - Roles
ClusterCockpit uses a specified set of user roles to steer data access and discriminate authorizations, primarily used in the web interface for different display of views, but also limiting data access when requests return from the server backend.
The roles currently implemented are:
User Role
The standard role for all users. By default, granted to all users imported from LDAP. It is also the default selection for the administrative “Create User” form.
Use Case: View and list personal jobs, view personal job detail, inspect metrics of personal jobs.
Access: Jobs started from the users account only.
Manager Role
A privileged role for project supervisors. This role has to be granted manually by administrators. If ClusterCockpit is configured to accept JWT logins from external management applications, it is possible to retain roles granted in the respective application, see JWT docs.
In addition to the role itself, one ore more projects need to be assigned to the user by administrators.
Use Case: In addition to personal job access, this role is intended to view and inspect all jobs of all users of the assigned projects (usergroups), in order to self-manage and identify problems of the subordinate user group.
Access: Personally started jobs, regardless of project. Additionally, all jobs started from all users of the assigned projects (usergroups).
Support Role
A privileged role for support staff. This role has to be granted manually by administrators. If ClusterCockpit is configured to accept JWT logins from external management applications, it is possible to retain roles granted in the respective application, see JWT docs.
In regard to job view access, this role is identical to administrators. However, webinterface view access differs and, most importantly, acces to administrative options is prohibited.
Use Case: In addition to personal job access, this role is intended to view and inspect all jobs of all users active on the clusters, in order to identify problems and give guidance for the userbase as a whole, supporting the administrative staff in these tasks.
Access: Personally started jobs, regardless of project. Additionally, all jobs started from all users on all configured clusters.
Administrator Role
The highest available authority for administrative staff only. This role has to be granted manually by other administrators. No JWT can ever grant this role.
All jobs from all active users on all systems can be accessed, as well as all webinterface views. In addition, the administrative options in the settings view are accessible.
Use Case: General access and ClusterCockpit administrative tasks from the settings page.
Access: General access.
API Role
An optional, technical role given to users in order to enable usage of the RESTful API endpoints. This role has to be granted manually by administrators. No JWT can ever grant this role.
This role can either be granted to a specialized “API User”, which does not have a password or any other roles, and therefore, can not log in by itself. Such an user is only intended to be used to generate JWT access tokens for scripted API access, for example.
Still, this role can be granted to actual users, for example, administrators to generate personal API tokens for testing.
Use Case: Interact with ClusterCockpits’ REST API.
Access: Allows usage of ClusterCockpits’ REST API.
7 - Reference
In-depth description of configuration options, file formats, and REST API interfaces.
7.1 - cc-backend
Reference information regarding the primary ClusterCockpit component “cc-backend” (GitHub Repo).
7.1.1 - Command Line
This page describes the command line options for the cc-backend executable.
-add-user <username>:[admin,support,manager,api,user]:<password>
Function: Add a new user. Only one role can be assigned.
Example: -add-user abcduser:manager:somepass
-apply-tags
Function: Run taggers on all completed jobs and exit.
-config <path>
Function: Specify alternative path to config.json.
Default: ./config.json
Example: -config ./configfiles/configuration.json
-del-user <username>
Function: Remove an existing user.
Example: -del-user abcduser
-dev
Function: Enable development components: GraphQL Playground and Swagger UI.
-force-db
Function: Force database version, clear dirty flag and exit.
-gops
Function: Listen via github.com/google/gops/agent (for debugging).
-import-job <path-to-meta.json>:<path-to-data.json>, ...
Function: Import a job. Argument format: <path-to-meta.json>:<path-to-data.json>,...
Example: -import-job ./to-import/job1-meta.json:./to-import/job1-data.json,./to-import/job2-meta.json:./to-import/job2-data.json
-init
Function: Setup var directory, initialize sqlite database file, config.json and .env.
-init-db
Function: Go through job-archive and re-initialize the job, tag, and
jobtag tables (all running jobs will be lost!).
-jwt <username>
Function: Generate and print a JWT for the user specified by its username.
Example: -jwt abcduser
-logdate
Function: Set this flag to add date and time to log messages.
-loglevel <level>
Function: Sets the logging level.
Arguments: debug | info | warn | err | crit
Default: warn
Example: -loglevel debug
-migrate-db
Function: Migrate database to supported version and exit.
-revert-db
Function: Migrate database to previous version and exit.
-server
Function: Start a server, continues listening on port after initialization and argument handling.
-sync-ldap
Function: Sync the hpc_user table with ldap.
-version
Function: Show version information and exit.
7.1.2 - Configuration
cc-backend requires a JSON configuration file. The configuration files is
structured into sections. Every section is configured either in a separate
JSON object or using a separate file. Sections are split into two categories:
- Required sections define integral settings, which are required for
cc-backendto start, and work, properly. - Optional Sections define additional options for specific use-cases or on-site requirements. We recommend to read through the available optional settings, e.g. the file archive config.
When a section is put in a separate file
the section key has to have a -file suffix, example:
"auth-file": "./var/auth.json"
To override the default config file path, specify the location of a JSON
configuration file with the -config <file path> command line option.
Configuration Options
Required Sections
Primary configuration sections, which key (e.g. main) has to exist on cc-backend start, or the application will shut down with an error.
Subsequent settings within the primary sections might be optional.
Section main
addr: Type string (Optional). Address where the http (or https) server will listen on (for example: ‘0.0.0.0:80’). Defaultlocalhost:8080.api-allowed-ips: Type array of strings (Optional). IPv4 addresses from which the secured administrator API endpoint functions/api/*can be reached. Default: No restriction. The previous*wildcard is still supported but obsolete.user: Type string (Optional). Drop root permissions once .env was read and the port was taken. Only applicable if using privileged port.group: Type string. Drop root permissions once .env was read and the port was taken. Only applicable if using privileged port.disable-authentication: Type bool (Optional). Disable authentication (for everything: API, Web-UI, …). Defaultfalse.embed-static-files: Type bool (Optional). If all files inweb/frontend/publicshould be served from within the binary itself (they are embedded) or not. Defaulttrue.static-files: Type string (Optional). Folder where static assets can be found, ifembed-static-filesisfalse. No default.db: Type string (Optional). The db file path. Default:./var/job.db.enable-job-taggers: Type bool (Optional). Enable automatic job taggers for application and job class detection. Requires to provide tagger rules. Default:false.validate: Type bool (Optional). Validate all input JSON documents against JSON schema. Default:false.session-max-age: Type string (Optional). Specifies for how long a session shall be valid as a string parsable by time.ParseDuration(). If 0 or empty, the session/token does not expire! Default168h.https-cert-fileandhttps-key-file: Type string (Optional). If both those options are not empty, use HTTPS using those certificates. Default: No HTTPS.redirect-http-to: Type string (Optional). If not the empty string andaddrdoes not end in “:80”, redirect every request incoming at port 80 to that url.stop-jobs-exceeding-walltime: Type int (Optional). If not zero, automatically mark jobs as stopped running X seconds longer than their walltime. Only applies if walltime is set for job. Default0.short-running-jobs-duration: Type int (Optional). Do not show running jobs shorter than X seconds. Default300.emission-constant: Type integer (Optional). Energy Mix CO2 Emission Constant [g/kWh]. If entered, UI displays estimated CO2 emission for job based on jobs’ total Energy.resampling: Type object (Optional). If configured, will enable dynamic downsampling of metric data using the configured values.minimum-points: Type integer. This option allows user to specify the minimum points required for resampling; Example: 600. If minimum-points: 600, assuming frequency of 60 seconds per sample, then a resampling would trigger only for jobs > 10 hours (600 / 60 = 10).resolutions: Type array [integer]. Array of resampling target resolutions, in seconds; Example: [600,300,60].trigger: Type integer. Trigger next zoom level at less than this many visible datapoints.
machine-state-dir: Type string (Optional). Where to store MachineState files. Used for persisting machine state between restarts.systemd-unit: Type string (Optional). Systemd unit name used for the system log viewer integration. Default:clustercockpit.api-subjects: Type object (Optional). NATS subjects configuration for subscribing to job and node events. When configured, the REST API endpoints forstart_jobandstop_jobare disabled in favor of NATS messaging. Default: No NATS API.subject-job-event: Type string (required). NATS subject for job events (start_job, stop_job).subject-node-state: Type string (required). NATS subject for node state updates.
nodestate-retention: Type object (Optional). Configuration for automatic cleanup of old node state records from the database. Runs daily. Default: No retention (node states accumulate indefinitely).policy: Type string (required). Retention policy. Possible values:delete(remove old records),move(archive to Parquet format then delete).age: Type integer (Optional). Retention age in hours. Records older than this are affected. Default:24.target-kind: Type string (Optional). Target storage kind for Parquet archiving:fileors3. Only applicable formovepolicy. Default:file.target-path: Type string (Optional). Filesystem path for Parquet file storage. Only applicable fortarget-kindfile.target-endpoint: Type string (Optional). S3 endpoint URL. Only applicable fortarget-kinds3.target-bucket: Type string (Optional). S3 bucket name. Only applicable fortarget-kinds3.target-access-key: Type string (Optional). S3 access key. Only applicable fortarget-kinds3.target-secret-key: Type string (Optional). S3 secret key. Only applicable fortarget-kinds3.target-region: Type string (Optional). S3 region. Only applicable fortarget-kinds3.target-use-path-style: Type bool (Optional). Use path-style S3 addressing. Required for MinIO and some S3-compatible services. Only applicable fortarget-kinds3.max-file-size-mb: Type integer (Optional). Maximum Parquet file size in MB before splitting into a new file. Default:128.
Section auth
jwts: Type object (required). For JWT Authentication.max-age: Type string (required). Configure how long a token is valid. As string parsable by time.ParseDuration().cookie-name: Type string (Optional). Cookie that should be checked for a JWT token.validate-user: Type bool (Optional). Deny login for users not in database (but defined in JWT). Overwrite roles in JWT with database roles.trusted-issuer: Type string (Optional). Issuer that should be accepted when validating external JWTs.sync-user-on-login: Type bool (Optional). Add non-existent user to DB at login attempt with values provided in JWT.update-user-on-login: Type bool (Optional). Update existent user in DB at login attempt with values provided in JWT. Name, Roles (excluding admin) and Projects are updated.
ldap: Type object (Optional). For LDAP Authentication and user synchronisation. Defaultnil.url: Type string (required). URL of LDAP directory server.user-base: Type string (required). Base DN of user tree root.search-dn: Type string (required). DN for authenticating LDAP admin account with general read rights.user-bind: Type string (required). Expression used to authenticate users via LDAP bind. Must containuid={username}.user-filter: Type string (required). Filter to extract users for syncing.username-attr: Type string (Optional). Attribute with full user name. Defaults togecosif not provided.sync-interval: Type string (Optional). Interval used for syncing local user table with LDAP directory. Parsed using time.ParseDuration.uid-attr: Type string (Optional). LDAP attribute used as login username. Defaults touidif not provided.sync-del-old-users: Type bool (Optional). Delete obsolete users in database.sync-user-on-login: Type bool (Optional). Add non-existent user to DB at login attempt if user exists in LDAP directory.update-user-on-login: Type bool. Update existent user in DB at login attempt with values provided. Name, Roles (excluding admin) and Projects are updated.
oidc: Type object (Optional). For OpenID Connect Authentication. Defaultnil.provider: Type string (required). OpenID Connect provider URL.sync-user-on-login: Type bool. Add non-existent user to DB at login attempt with values provided.update-user-on-login: Type bool. Update existent user in DB at login attempt with values provided. Name, Roles (excluding admin) and Projects are updated.
Section metric-store
retention-in-memory: Type string (required). Keep the metrics within memory for given time interval. Retention for X hours, then the metrics would be freed. Buffers that are still used by running jobs will be kept.memory-cap: Type integer (required). If memory used exceeds value in GB, buffers still used by long running jobs will be freed.num-workers: Type integer (Optional). Number of concurrent workers for checkpoint and archive operations. Default: If not set defaults tomin(runtime.NumCPU()/2+1, 10)checkpoints: Type object (required). Configuration for checkpointing the metrics buffersfile-format: Type string (Optional). Format to use for checkpoint files. Can bejson(human-readable, periodic) orwal(binary snapshot + Write-Ahead Log, crash-safe). Default:wal.directory: Type string (Optional). Path in which the checkpoints should be placed. Default:./var/checkpoints.
cleanup: Type object (Optional). Configuration for the cleanup process. The cleanup interval always equals theretention-in-memoryinterval. If not set, themodedefaults todelete.mode: Type string (Optional). The mode for cleanup. Can bedeleteorarchive. Default:delete.directory: Type string (required if mode isarchive). Directory where to put the archive files.
nats-subscriptions: Type array (Optional). List of NATS subjects the metric store should subscribe to. Items are of type object with the following attributes:subscribe-to: Type string (required). NATS subject to subscribe to.cluster-tag: Type string (Optional). Allow lines without a cluster tag, use this as default.
Section cron
commit-job-worker: Type string. Frequency of commit job worker. Default:2mduration-worker: Type string. Frequency of duration worker. Default:5mfootprint-worker: Type string. Frequency of footprint. Default:10m
Optional Sections
Secondary configuration sections, which key (e.g. nats) can be missing from the configuration without interfering with cc-backend starts.
Subsequent settings within the secondary sections might be optional.
Section archive
If section is not provided, the default is kind set to file with path set to ./var/job-archive.
kind: Type string (required). Set archive backend. Supported values:file,s3,sqlite.path: Type string (Optional). Path to the job-archive. Only applicable forfilebackend. Default:./var/job-archive.db-path: Type string (Optional). Path to SQLite database file. Only applicable forsqlitebackend.endpoint: Type string (Optional). S3 endpoint URL. Only applicable fors3backend. Required for S3-compatible services like MinIO.access-key: Type string (Optional). S3 access key ID. Only applicable fors3backend.secret-key: Type string (Optional). S3 secret access key. Only applicable fors3backend.bucket: Type string (Optional). S3 bucket name. Only applicable fors3backend.region: Type string (Optional). S3 region. Only applicable fors3backend.use-path-style: Type bool (Optional). Use path-style S3 URLs. Required for MinIO and some S3-compatible services. Only applicable fors3backend.compression: Type integer (Optional). Setup automatic compression for jobs older than number of days. Default:7.retention: Type object (Optional). Enable retention policy for archive and database. Retention jobs run once daily at fixed times.policy: Type string (required). Retention policy. Possible values:none(disabled),delete(remove from archive and optionally DB),copy(copy to target without removing source),move(copy to target then remove source).format: Type string (Optional). Output format forcopyandmovepolicies. Possible values:json(standard archive format, default),parquet(columnar Parquet format for long-term storage).include-db: Type bool (Optional). Also remove jobs from database when deleting from archive. Default:true.omit-tagged: Type string (Optional). Control which tagged jobs are skipped by the retention policy. Possible values:none(apply retention to all jobs, default),all(skip any job that has at least one tag),user(skip jobs that have user-created tags; auto-tagger tags of typeapporjobClassdo not count as user tags).age: Type integer (Optional). Act on jobs with startTime older than age (in days). Default:7.target-kind: Type string (Optional). Target storage kind forcopyandmovepolicies:fileors3. Default:file.target-path: Type string (Optional). Filesystem path for the target storage. Only applicable fortarget-kindfile.target-endpoint: Type string (Optional). S3 endpoint URL for target. Only applicable fortarget-kinds3.target-bucket: Type string (Optional). S3 bucket name for target. Only applicable fortarget-kinds3.target-access-key: Type string (Optional). S3 access key for target. Only applicable fortarget-kinds3.target-secret-key: Type string (Optional). S3 secret key for target. Only applicable fortarget-kinds3.target-region: Type string (Optional). S3 region for target. Only applicable fortarget-kinds3.target-use-path-style: Type bool (Optional). Use path-style S3 URLs for target. Only applicable fortarget-kinds3.max-file-size-mb: Type integer (Optional). Maximum Parquet file size in MB before splitting into a new file. Only applicable whenformatisparquet. Default:512.
Section nats
address: Type string. Address of the NATS server (e.g.,nats://localhost:4222).username: Type string (Optional). Username for NATS authentication.password: Type string (Optional). Password for NATS authentication (optional).creds-file-path: Type string (Optional). Path to NATS credentials file for authentication (optional).
Section metric-store-external
Configures external cc-metric-store instances for reading
metric data. This is an array of objects, each mapping a scope (cluster name or
* wildcard) to an external metric store URL. When configured alongside the
internal metric-store section, the external stores extend the available metric
sources.
Each array entry has the following properties:
scope: Type string (required). Scope identifier for routing metric queries. Use a cluster name to route queries for that specific cluster, or*as a default fallback for any unmatched cluster.url: Type string (required). URL of the external cc-metric-store endpoint (e.g.,http://host:8082).token: Type string (required). Authentication token (JWT) for the external metric store.
Example:
"metric-store-external": [
  {
    "scope": "*",
    "url": "http://metricstore-default:8082",
    "token": "eyJhbGci..."
  },
  {
    "scope": "fritz",
    "url": "http://metricstore-fritz:8084",
    "token": "eyJhbGci..."
  }
]
Section ui
The ui section specifies defaults for the web user interface. The defaults
which metrics to show in different views can be overwritten per cluster or
subcluster.
job-list: Type object (Optional). Job list defaults. Applies to user and jobs views.use-paging: Type bool (Optional). If classic paging is used instead of continuous scrolling by default.show-footprint: Type bool (Optional). If footprint bars are shown as first column by default.
node-list: Type object (Optional). Node list defaults. Applies to node list view.use-paging: Type bool (Optional). If classic paging is used instead of continuous scrolling by default.
job-view: Type object (Optional). Job view defaults.show-polar-plot: Type bool (Optional). If the job metric footprints polar plot is shown by default.show-footprint: Type bool (Optional). If the annotated job metric footprint bars are shown by default.show-roofline: Type bool (Optional). If the job roofline plot is shown by default.show-stat-table: Type bool (Optional). If the job metric statistics table is shown by default.
metric-config: Type object (Optional). Global initial metric selections for primary views of all clusters.job-list-metrics: Type array [string] (Optional). Initial metrics shown for new users in job lists (User and jobs view).job-view-plot-metrics: Type array [string] (Optional). Initial metrics shown for new users as job view metric plots.job-view-table-metrics: Type array [string] (Optional). Initial metrics shown for new users in job view statistics table.clusters: Type array of objects (Optional). Overrides for global defaults by cluster and subcluster.name: Type string (required). The name of the cluster.job-list-metrics: Type array [string] (Optional). Initial metrics shown for new users in job lists (User and jobs view) for this cluster.job-view-plot-metrics: Type array [string] (Optional). Initial metrics shown for new users as job view timeplots for this cluster.job-view-table-metrics: Type array [string] (Optional). Initial metrics shown for new users in job view statistics table for this cluster.sub-clusters: Type array of objects (Optional). The array of overrides per subcluster.name: Type string (required). The name of the subcluster.job-list-metrics: Type array [string] (Optional). Initial metrics shown for new users in job lists (User and jobs view) for subcluster.job-view-plot-metrics: Type array [string] (Optional). Initial metrics shown for new users as job view timeplots for subcluster.job-view-table-metrics: Type array [string] (Optional). Initial metrics shown for new users in job view statistics table for subcluster.
plot-configuration: Type object (Optional). Initial settings for plot render options.color-background: Type bool (Optional). If the metric plot backgrounds are initially colored by threshold limits.plots-per-row: Type integer (Optional). How many plots are initially rendered per row. Applies to job, single node, and analysis views.line-width: Type integer (Optional). Initial thickness of rendered plotlines. Applies to metric plot, job compare plot and roofline.color-scheme: Type array [string] (Optional). Initial colorScheme to be used for metric plots.
7.1.3 - Environment
All security-related configurations, e.g. keys and passwords, are set using
environment variables. It is supported to set these by means of a .env file in
the project root.
Environment Variables
JWT_PUBLIC_KEYandJWT_PRIVATE_KEY: Base64 encoded Ed25519 keys used for JSON Web Token (JWT) authentication. You can generate your own keypair usinggo run ./tools/gen-keypair/. The release binaries also include thegen-keypairtool for x86-64. For more information, see the JWT documentation.SESSION_KEY: Some random bytes used as secret for cookie-based sessionsLDAP_ADMIN_PASSWORD: The LDAP admin user password (optional)CROSS_LOGIN_JWT_HS512_KEY: Used for token based logins via another authentication service (optional)OID_CLIENT_ID: OpenID connect client id (optional)OID_CLIENT_SECRET: OpenID connect client secret (optional)
Template .env file
Below is an example .env file.
Copy it as .env into the project root and adapt it for your needs.
# Base64 encoded Ed25519 keys (DO NOT USE THESE TWO IN PRODUCTION!)
# You can generate your own keypair using `go run tools/gen-keypair/main.go`
JWT_PUBLIC_KEY="kzfYrYy+TzpanWZHJ5qSdMj5uKUWgq74BWhQG6copP0="
JWT_PRIVATE_KEY="dtPC/6dWJFKZK7KZ78CvWuynylOmjBFyMsUWArwmodOTN9itjL5POlqdZkcnmpJ0yPm4pRaCrvgFaFAbpyik/Q=="

# Base64 encoded Ed25519 public key for accepting externally generated JWTs
# Keys in PEM format can be converted, see `tools/convert-pem-pubkey/Readme.md`
CROSS_LOGIN_JWT_PUBLIC_KEY=""

# Some random bytes used as secret for cookie-based sessions (DO NOT USE THIS ONE IN PRODUCTION)
SESSION_KEY="67d829bf61dc5f87a73fd814e2c9f629"

# Password for the ldap server (optional)
LDAP_ADMIN_PASSWORD="mashup"
7.1.4 - REST API
REST API Authorization
In ClusterCockpit JWTs are signed using a public/private key pair using ED25519.
Because tokens are signed using public/private key pairs, the signature also
certifies that only the party holding the private key is the one that signed it.
JWT tokens in ClusterCockpit are not encrypted, means all information is clear
text. Expiration of the generated tokens can be configured in config.json using
the max-age option in the jwts object. Example:
"jwts": {
    "max-age": "168h"
},
The party that generates and signs JWT tokens has to be in possession of the
private key and any party that accepts JWT tokens must possess the public key to
validate it. cc-backed therefore requires both keys, the private one to
sign generated tokens and the public key to validate tokens that are provided by
REST API clients.
Generate ED25519 key pairs
We provide a tool as part of cc-backend to generate a ED25519 keypair.
The tool is called gen-keypair and provided as part of the release binaries.
You can easily build it yourself in the cc-backend source tree with:
go build tools/gen-keypair
To use it just call it without any arguments:
./gen-keypair
Usage of Swagger UI documentation
Swagger UI is a REST API documentation and testing framework. To use the Swagger UI for testing you have to run an instance of cc-backend on localhost (and use the default port 8080):
./cc-backend -server
You may want to start the demo as described here .
This Swagger UI is also available as part of cc-backend if you start it with
the dev option:
./cc-backend -server -dev
You may access it at this URL.
Conditional Endpoints
When api-subjects is configured in the main section of config.json (i.e.,
NATS messaging is enabled for job events), the REST API endpoints
/api/jobs/start_job/ and /api/jobs/stop_job/ are disabled. Job
start/stop operations are then handled exclusively via NATS. All other REST
endpoints remain available regardless of NATS configuration.
API Endpoint Groups
The REST API is organized into several route groups:
- Admin API (
/api/): Full job and cluster management, requires admin/API role JWT. - User API (
/userapi/): Read-only job query endpoints for regular users. - Metric Store API (
/metricstore/): Metric data ingestion, health checks, and debugging endpoints. - Config API (
/config/): User management and configuration, uses session authentication. - Frontend API (
/frontend/): JWT generation and user config updates, uses session authentication.
Swagger API Reference
Non-Interactive Documentation
This reference is rendered using theswaggerui plugin based on the original definition file found in the ClusterCockpit repository, but without a serving backend.This means that all interactivity (“Try It Out”) will not return actual data. However, a Curl call and a compiled Request URL will still be displayed, if an API endpoint is executed.Administrator API
Endpoints displayed here correspond to the administrator/api/ endpoints, but user-accessible /userapi/ endpoints are functionally identical. See these lists for information about accessibility.7.1.5 - Authentication Handbook
Introduction
cc-backend supports the following authentication methods:
- Local login, with credentials stored in SQL database
- LDAP login, with authentication to a LDAP directory
- OpenID Connect login, with authentication against a KeyCloak instance
- JWT login, with authentication via JSON Web Token:
- With token provided in HTML request header
- With token provided in cookie
All above methods create a session cookie that is then used for subsequent authentication of requests. Multiple authentication methods can be configured at the same time. If LDAP is enabled it takes precedence over local authentication. The OpenID Connect method against a KeyCloak instance enables many more authentication methods using the ability of KeyCloak to act as an Identity Broker.
The REST API uses stateless authentication via a JWT token, which means that every requests must be authenticated.
Authorization control
cc-backend uses roles to decide if a user is authorized to access certain
information. The roles and their rights are described in more detail here.
General configuration options
All configuration is part of the cc-backend configuration file config.json.
The primary key for authentication configuration options is auth.
All security sensitive options as passwords and tokens are passed in terms of
environment variables. cc-backend supports to read an .env file upon startup
and set the environment variables contained there.
Duration of session
Per default the maximum duration of a session is 7 days. To change this the
option main.session-max-age has to be set to a string that can be parsed by the
Golang time.ParseDuration() function.
For most use cases the largest unit h is the only relevant option.
To enable unlimited session duration set main.session-max-age either to 0 or empty
string.
Example
"main": {
  "session-max-age": "24h",
}
Local authentication
No configuration is required for local authentication.
Usage
You can add an user on the command line using the flag -add-user:
./cc-backend -add-user <username>:<roles>:<password>
Example:
./cc-backend -add-user fritz:admin,api:myPass
Roles can be admin, support, manager, api, and user.
Users can be deleted using the flag -del-user:
./cc-backend -del-user fritz
Warning
The option-del-user as currently implemented will delete ALL users that
match the username independent of its origin. This means it will also delete
user records that were added from LDAP or JWT tokens.LDAP authentication
Configuration
To enable LDAP authentication the following set of options are required as
attributes of the auth.ldap JSON object:
url: URL of the LDAP directory server. This must be a complete URL including the protocol and not only the host name. Example:ldaps://ldsrv.mydomain.com.user-base: Base DN of user tree root. Example:ou=people,ou=users,dc=rz,dc=mydomain,dc=com.search-dn: DN for authenticating an LDAP admin account with general read rights. This is required for the sync on login and the sync options. Example:cn=monitoring,ou=adm,ou=profile,ou=manager,dc=rz,dc=mydomain,dc=comuser-bind: Expression used to authenticate users via LDAP bind. Must containuid={username}. Example:uid={username},ou=people,ou=users,dc=rz,dc=mydomain,dc=com.user-filter: Filter to extract users for syncing. Example:(&(objectclass=posixAccount)).
Optional configuration options are:
username-attr: Attribute with full user name. Defaults togecosif not provided.sync-interval: Interval used for syncing SQL user table with LDAP directory. Parsed using time.ParseDuration. The sync interval is always relative to the timecc-backendwas started. Example:24h.sync-del-old-users: Type boolean. Delete users in SQL database if not in LDAP directory anymore. This of course only applies to users that were added from LDAP.sync-user-on-login: Type boolean. Add non-existent user to database at login attempt if user exists in LDAP directory. This option enables that users can login at once after they are added to the LDAP directory. Does not update user on recurring LDAP logins.update-user-on-login: Type boolean. Update existent users in DB at login attempt if user exists in LDAP directory. This option updates changed source attributes, for example the name, if the database value differs. Does not add users on first-time LDAP login.
Example
"auth": {
  "ldap": {
    "url": "ldaps://ldsrv.mydomain.com",
    "user-base": "ou=people,ou=users,dc=rz,dc=mydomain,dc=com",
    "search-dn": "cn=monitoring,ou=adm,ou=profile,ou=manager,dc=rz,dc=mydomain,dc=com",
    "user-bind": "uid={username},ou=people,ou=users,dc=rz,dc=mydomain,dc=com",
    "user-filter": "(&(objectclass=posixAccount))"
  },
}
Environment
The LDAP authentication method requires the environment variable
LDAP_ADMIN_PASSWORD for the search-dn account that is used to sync users.
Usage
If LDAP is configured it is the first authentication method that is tried if a
user logs in using the login form. A sync with the LDAP directory can also be
triggered from the command line using the flag -sync-ldap.
OpenID Connect authentication
Configuration
To enable OpenID Connect authentication the following set of options are
required below a top-level auth.oidc key:
provider: The base URL of your OpenID Connect provider. Example:https://auth.example.com/realms/mycloud.
Optional configuration options are:
sync-user-on-login: Type boolean. Add non-existent user to DB at login attempt if user exists in KeyCloak realm. This option enables that users can login at once after they are added to the KeyCloak realm. Does not update user on recurring OIDC logins.update-user-on-login: Type boolean. Update existent users in DB at login attempt if user exists in KeyCloak realm. This option updates changed source attributes, for example the name, if the database value differs. Does not add users on first-time OIDC login.
Example
"oidc": {
  "provider": "https://auth.server.com:8080/realms/nhr-cloud"
},
Environment
Furthermore the following environment variables have to be set (in the .env
file):
OID_CLIENT_ID: Set this to the Client ID you configured in Keycloak (see below).OID_CLIENT_SECRET: Set this to the Client ID secret available in your Keycloak Open ID Client configuration at theCredentialstab (see below).
Required settings in KeyCloak
The OpenID Connect implementation was only tested against the KeyCloak provider.
Steps to setup KeyCloak:
- Create a new realm. This will determine the provider URL.
- Create a new OpenID Connect client
- Set a Client ID
- The Client ID secret is automatically generated after the client has been created.
- Enable
client authentication - For Access settings set:
Root URL: This is the base URL of your cc-backend instance.Valid redirect URLs: Set this tooidc-callback.- Add an additional URL including the full HTTP path, e.g.
http://localhost:8088/oidc-callback - If HTTPS is used, also add the HTTPS path, e.g.
https://localhost:8088/oidc-callback
- Add an additional URL including the full HTTP path, e.g.
Web origins: Set this also to the base URL of your cc-backend instance.
- Set a Client ID
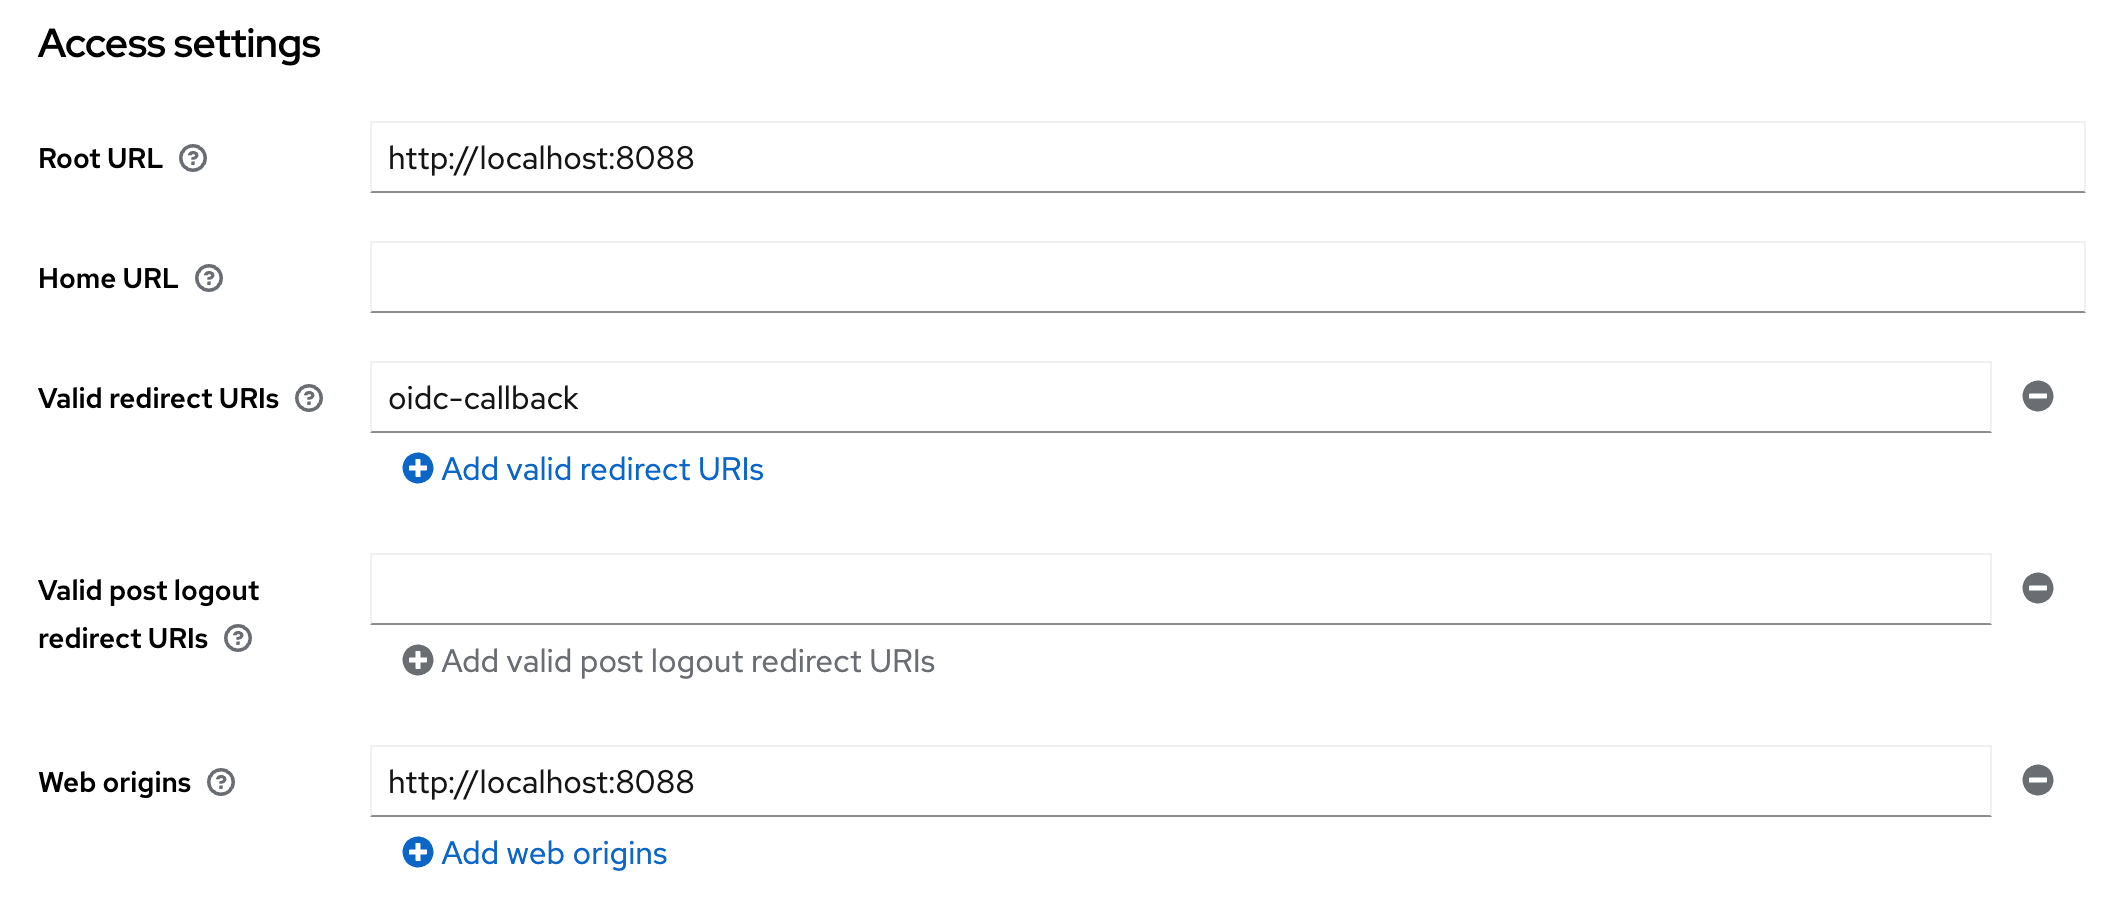
Keycloak client Access settings
- Enable PKCE:
- Click on Advanced tab. Further click on Advanced Settings on the right side.
- Set the option
Proof Key for Code Exchange Code Challenge MethodtoS256.
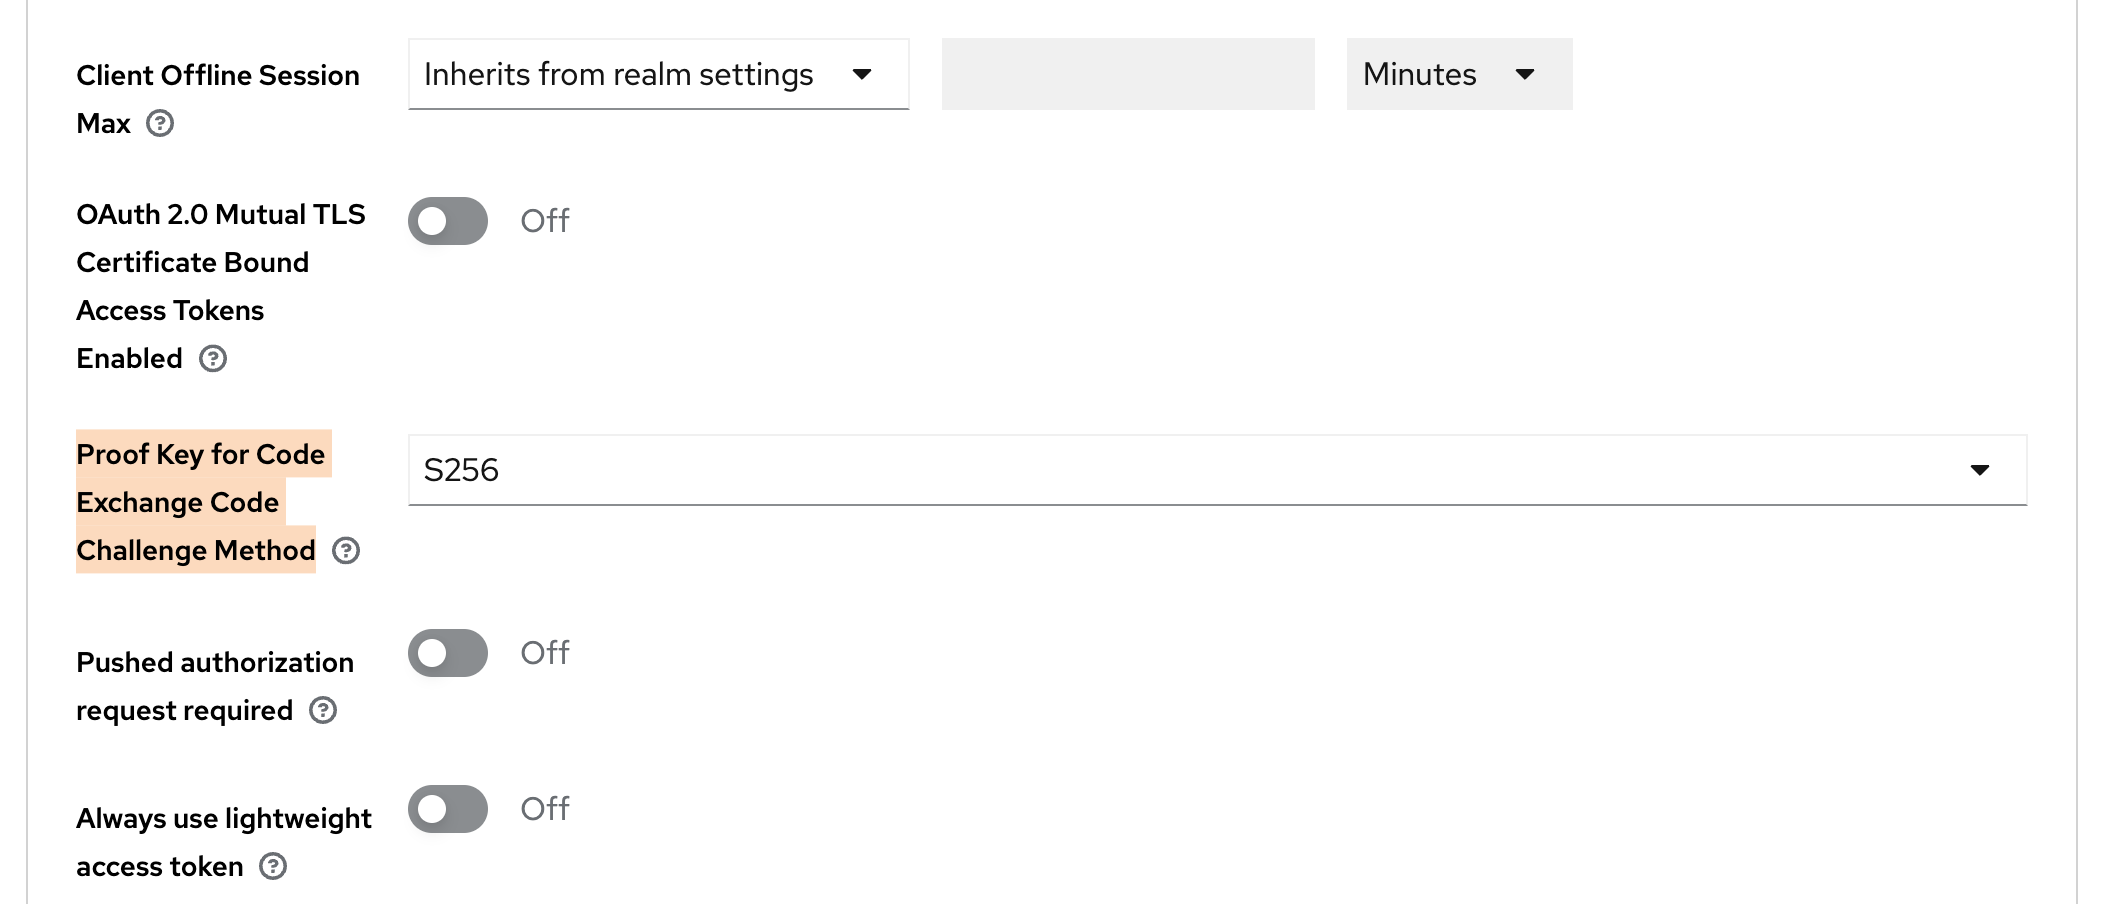
Keycloak advanced client settings for PKCE
Everything else can be left to the default.
Do not forget to create users in your realm before testing.
Usage
If the auth.oidc config key is correctly set and the required environment variables
are available, an additional button for OpenID Connect Login is shown below the
login mask. If pressed this button will redirect to the OpenID Connect login.
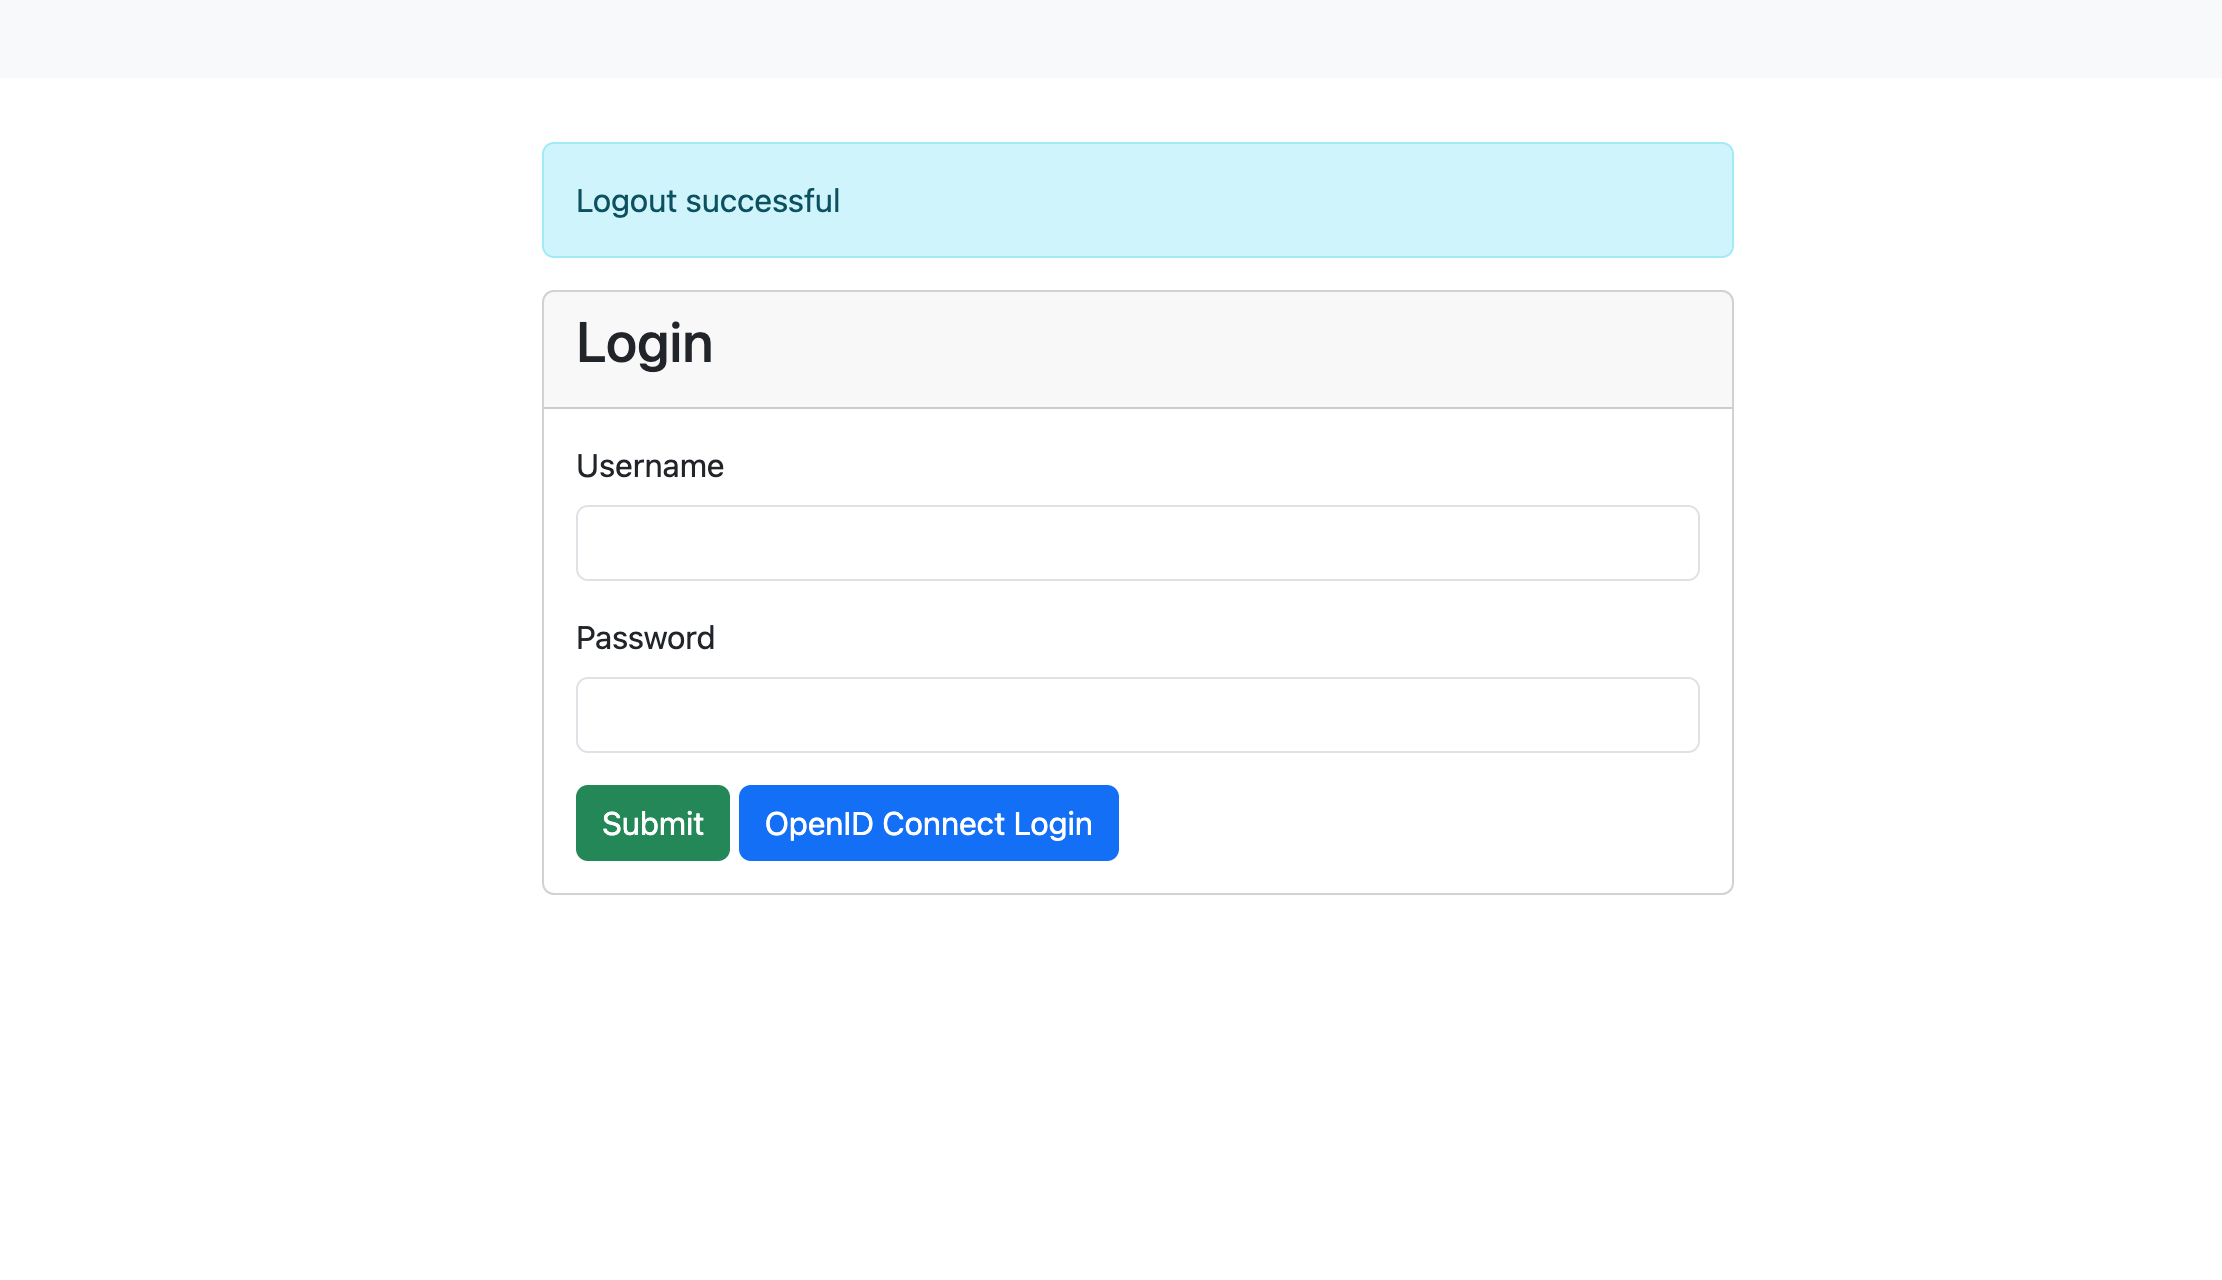
Login mask with OpenID Connect enabled
Info
If you are using a modified login.tmpl in ./var/. check for the following condition, else, add it below the submit button:
[... CONTENT ...]
  <button type="submit" class="btn btn-success">Submit</button>
  {{if .Infos.hasOpenIDConnect}}
      <a class="btn btn-primary" href="/oidc-login">OpenID Connect Login</a>
  {{end}}
[...CONTENT...]
JWT token authentication
JSON web tokens are a standardized method for representing encoded claims securely between two parties. In ClusterCockpit they are used for authorization to use REST APIs as well as a method to delegate authentication to a third party. This section only describes JWT based authentication for initiating a user session.
Two variants exist:
- [1] Session Authenticator: Passes JWT token in the HTTP header Authorization using the Bearer prefix or using the query key login-token.
Example for Authorization header:
Authorization: Bearer S0VLU0UhIExFQ0tFUiEK
Example for query key used as form action in external application:
<form method="post" action="$CCROOT/jwt-login?login-token=S0VLU0UhIExFQ0tFUiEK" target="_blank">
  <button type="submit">Access CC</button>
</form>
- [2] Cookie Session Authenticator: Reads the JWT token from a named cookie provided by the request, which is deleted after the session was successfully initiated. This is a more secure alternative to the standard header based solution.
JWT Configuration
- [0] Basic required configuration:
In order to enable JWT based transactions generally, the following has to be true:
- The
jwtsJSON object has to exist withinconfig.json, even if no other attribute is set within.- We recommend to set
max-ageattribute: Specifies for how long a JWT token shall be valid, defined as a string parsable bytime.ParseDuration(). - This will only affect JWTs generated by ClusterCockpit, e.g. for the use with REST-API endpoints.
- We recommend to set
In addition, the the following environment variables are used:
JWT_PRIVATE_KEY: The applications own private key to be used with JWT transactions. Required for cookie based logins and REST-API communication.JWT_PUBLIC: The applications own public key to be used with JWT transactions. Required for cookie based logins and REST-API communication.[1] Configuration for JWT Session Authenticator:
Compatible signing methods are: HS256, HS512
Only a shared (symmetric) key saved as environment variable CROSS_LOGIN_JWT_HS512_KEY is required.
- [2] Configuration for JWT Cookie Session Authenticator:
Tokens are signed with: Ed25519/EdDSA
To enable JWT authentication via cookie the following set of options are required as attributes of the jwts JSON object:
cookie-name(String): Specifies which cookie should be checked for a JWT token (if no authorization header is present)trusted-issuer(String): Specifies which issuer should be accepted when validating external JWTs (iss-claim)
In addition, the Cookie Session Authenticator method requires the following environment variable:
CROSS_LOGIN_JWT_PUBLIC_KEY: Primary public key for this method, validates identity of tokens received fromtrusted-issuerand must therefore match accordingly.[3] Optional configuration attributes of the
jwtsJSON object, valid for both [1] and [2], are:validate-user(Bool): Load user by username encoded insub-claim from database, including roles, denying login if not matched in database. Ignores all other claims. By design not combinable with bothsync-user-on-loginand/orupdate-user-on-loginoptions.sync-user-on-login(Bool): If user encoded in token does not exist in database, add a new user entry. Does not update user on recurring JWT logins.update-user-on-login(Bool): If user encoded in token does exist in database, update the user entry with all encoded information. Does not add users on first-time JWT login.
JWT Usage
- [1] Usage for JWT Session Authenticator:
The endpoint for initiating JWT logins in ClusterCockpit is /jwt-login
For login with JWT Header, the header has to include the Authorization: Bearer $TOKEN information when accessing this endpoint.
For login with JWT request parameter, the external website has to submit an action with the parameter ?login-token=$TOKEN (See example above).
In both cases, the JWT should contain the following parameters:
sub: The subject, in this case this is the username. Will be used for user matching ifvalidate-useris set.exp: Expiration in Unix epoch time. Can be small as the token is only used during login.name: The full name of the person assigned to this account. Will be used to update user table.roles: String array with roles of user.projects: [Optional] String array with projects of user. Relevant if user hasmanager-role.[2] Usage for JWT Cookie Session Authenticator:
The token must be set within a cookie with a name matching the configured cookie-name.
The JWT should then contain the following parameters:
sub: The subject, in this case this is the username. Will be used for user matching ifvalidate-useris set.exp: Expiration in Unix epoch time. Can be small as the token is only used during login.name: The full name of the person assigned to this account. Will be used to update user table.roles: String array with roles of user.
7.1.6 - Job Archive Handbook
The job archive specifies an exchange format for job meta and performance metric data. It consists of two parts:
- a Json file format
- a Directory hierarchy / Key specification
By using an open, portable and simple specification based on JSON objects it is possible to exchange job performance data for research and analysis purposes as well as use it as a robust way for archiving job performance data.
The current release supports new SQLite and S3 object store based job archive backends. Those are still experimental and for production we still recommend to use the proven file based job archive. One major disadvantage of the file based job archive backend is that for large job counts it will consume a lot of inodes.
Trying the new job-archive backends
We provide the tool archive-manager that allows to convert between different
job-archive formats. This allows to convert your existing file-based job-archive
into either a SQLite or S3 variant. Please be aware that for large archives this
may take a long time. You can find details about how to use this tool in the
archive-manager reference
documentation.
Specification for file path / key
To manage the number of directories within a single directory a tree approach is used splitting the integer job ID. The job id is split in junks of 1000 each. Usually 2 layers of directories is sufficient but the concept can be used for an arbitrary number of layers.
For a 2 layer schema this can be achieved with (code example in Perl):
$level1 = $jobID/1000;
$level2 = $jobID%1000;
$dstPath = sprintf("%s/%s/%d/%03d", $trunk, $destdir, $level1, $level2);
While for the SQLite and S3 object store based backend the systematic to introduce layers is obsolete we kept it to keep the naming consistent. This means what is the path in case of the file based backend is used as a object key and column value there.
Example
For the job ID 1034871 on cluster large with start time 1768978339 the key
is ./large/1034/871/1768978339.
Create a Job archive from scratch
In case you place the job-archive in the ./var folder create the folder with:
mkdir -p ./var/job-archive
The job-archive is versioned, the current version is documented in the Release Notes. Currently you have to create the version file manually when initializing the job-archive:
echo 3 > ./var/job-archive/version.txt
Directory layout
ClusterCockpit supports multiple clusters, for each cluster you need to create a
directory named after the cluster and a cluster.json file specifying the metric
list and hardware partitions within the clusters. Hardware partitions are
subsets of a cluster with homogeneous hardware (CPU type, memory capacity, GPUs)
that are called subclusters in ClusterCockpit.
For above configuration the job archive directory hierarchy looks like the following:
./var/job-archive/
     version.txt
     fritz/
        cluster.json
     alex/
        cluster.json
     woody/
        cluster.json
Note
Thecluster.json files currently have to be provided and maintained by the administrator!You find help how-to create a cluster.json file in the How to create a
cluster.json file guide.
Json file format
Overview
Every cluster must be configured in a cluster.json file.
The job data consists of two files:
meta.json: Contains job meta information and job statistics.data.json: Contains complete job data with time series
The description of the json format specification is available as [[json
schema|https://json-schema.org/]] format file. The latest version of the json
schema is part of the cc-backend source tree. For external reference it is
also available in a separate repository.
Specification cluster.json
The json schema specification in its raw format is available at the cc-lib GitHub repository. A variant rendered for better readability is found in the references.
Specification meta.json
The json schema specification in its raw format is available at the cc-lib GitHub repository. A variant rendered for better readability is found in the references.
Specification data.json
The json schema specification in its raw format is available at the cc-lib GitHub repository. A variant rendered for better readability is found in the references.
Metric time series data is stored for a fixed time step. The time step is set
per metric. If no value is available for a metric time series data timestamp
null is entered.
7.1.7 - Schemas
ClusterCockpit Schema References for
- Application Configuration
- Cluster Configuration
- Job Data
- Job Statistics
- Units
- Job Archive Job Metadata
- Job Archive Job Metricdata
The schemas in their raw form can be found in the ClusterCockpit GitHub repository.
Manual Updates
Changes to the original JSON schemas found in the repository are not automatically rendered in this reference documentation.The raw JSON schemas are parsed and rendered for better readability using the json-schema-for-humans utility.Last Update: 04.12.20247.1.7.1 - Application Config Schema
A detailed description of each of the application configuration options can be found in the config documentation.
The following schema in its raw form can be found in the ClusterCockpit GitHub repository.
Manual Updates
Changes to the original JSON schema found in the repository are not automatically rendered in this reference documentation.Last Update: 04.12.2024cc-backend configuration file schema
- 1. Property
cc-backend configuration file schema > addr - 2. Property
cc-backend configuration file schema > apiAllowedIPs - 3. Property
cc-backend configuration file schema > user - 4. Property
cc-backend configuration file schema > group - 5. Property
cc-backend configuration file schema > disable-authentication - 6. Property
cc-backend configuration file schema > embed-static-files - 7. Property
cc-backend configuration file schema > static-files - 8. Property
cc-backend configuration file schema > db-driver - 9. Property
cc-backend configuration file schema > db - 10. Property
cc-backend configuration file schema > archive- 10.1. Property
cc-backend configuration file schema > archive > kind - 10.2. Property
cc-backend configuration file schema > archive > path - 10.3. Property
cc-backend configuration file schema > archive > compression - 10.4. Property
cc-backend configuration file schema > archive > retention- 10.4.1. Property
cc-backend configuration file schema > archive > retention > policy - 10.4.2. Property
cc-backend configuration file schema > archive > retention > include-db - 10.4.3b. Property
cc-backend configuration file schema > archive > retention > omit-tagged - 10.4.3. Property
cc-backend configuration file schema > archive > retention > age - 10.4.4. Property
cc-backend configuration file schema > archive > retention > location
- 10.4.1. Property
- 10.1. Property
- 11. Property
cc-backend configuration file schema > disable-archive - 12. Property
cc-backend configuration file schema > validate - 13. Property
cc-backend configuration file schema > session-max-age - 14. Property
cc-backend configuration file schema > https-cert-file - 15. Property
cc-backend configuration file schema > https-key-file - 16. Property
cc-backend configuration file schema > redirect-http-to - 17. Property
cc-backend configuration file schema > stop-jobs-exceeding-walltime - 18. Property
cc-backend configuration file schema > short-running-jobs-duration - 19. Property
cc-backend configuration file schema > emission-constant - 20. Property
cc-backend configuration file schema > cron-frequency - 21. Property
cc-backend configuration file schema > enable-resampling - 22. Property
cc-backend configuration file schema > jwts- 22.1. Property
cc-backend configuration file schema > jwts > max-age - 22.2. Property
cc-backend configuration file schema > jwts > cookieName - 22.3. Property
cc-backend configuration file schema > jwts > validateUser - 22.4. Property
cc-backend configuration file schema > jwts > trustedIssuer - 22.5. Property
cc-backend configuration file schema > jwts > syncUserOnLogin
- 22.1. Property
- 23. Property
cc-backend configuration file schema > oidc - 24. Property
cc-backend configuration file schema > ldap- 24.1. Property
cc-backend configuration file schema > ldap > url - 24.2. Property
cc-backend configuration file schema > ldap > user_base - 24.3. Property
cc-backend configuration file schema > ldap > search_dn - 24.4. Property
cc-backend configuration file schema > ldap > user_bind - 24.5. Property
cc-backend configuration file schema > ldap > user_filter - 24.6. Property
cc-backend configuration file schema > ldap > username_attr - 24.7. Property
cc-backend configuration file schema > ldap > sync_interval - 24.8. Property
cc-backend configuration file schema > ldap > sync_del_old_users - 24.9. Property
cc-backend configuration file schema > ldap > syncUserOnLogin
- 24.1. Property
- 25. Property
cc-backend configuration file schema > clusters- 25.1. cc-backend configuration file schema > clusters > clusters items
- 25.1.1. Property
cc-backend configuration file schema > clusters > clusters items > name - 25.1.2. Property
cc-backend configuration file schema > clusters > clusters items > metricDataRepository- 25.1.2.1. Property
cc-backend configuration file schema > clusters > clusters items > metricDataRepository > kind - 25.1.2.2. Property
cc-backend configuration file schema > clusters > clusters items > metricDataRepository > url - 25.1.2.3. Property
cc-backend configuration file schema > clusters > clusters items > metricDataRepository > token
- 25.1.2.1. Property
- 25.1.3. Property
cc-backend configuration file schema > clusters > clusters items > filterRanges- 25.1.3.1. Property
cc-backend configuration file schema > clusters > clusters items > filterRanges > numNodes - 25.1.3.2. Property
cc-backend configuration file schema > clusters > clusters items > filterRanges > duration - 25.1.3.3. Property
cc-backend configuration file schema > clusters > clusters items > filterRanges > startTime
- 25.1.3.1. Property
- 25.1.1. Property
- 25.1. cc-backend configuration file schema > clusters > clusters items
- 26. Property
cc-backend configuration file schema > ui-defaults- 26.1. Property
cc-backend configuration file schema > ui-defaults > plot_general_colorBackground - 26.2. Property
cc-backend configuration file schema > ui-defaults > plot_general_lineWidth - 26.3. Property
cc-backend configuration file schema > ui-defaults > plot_list_jobsPerPage - 26.4. Property
cc-backend configuration file schema > ui-defaults > plot_view_plotsPerRow - 26.5. Property
cc-backend configuration file schema > ui-defaults > plot_view_showPolarplot - 26.6. Property
cc-backend configuration file schema > ui-defaults > plot_view_showRoofline - 26.7. Property
cc-backend configuration file schema > ui-defaults > plot_view_showStatTable - 26.8. Property
cc-backend configuration file schema > ui-defaults > system_view_selectedMetric - 26.9. Property
cc-backend configuration file schema > ui-defaults > job_view_showFootprint - 26.10. Property
cc-backend configuration file schema > ui-defaults > job_list_usePaging - 26.11. Property
cc-backend configuration file schema > ui-defaults > analysis_view_histogramMetrics - 26.12. Property
cc-backend configuration file schema > ui-defaults > analysis_view_scatterPlotMetrics - 26.13. Property
cc-backend configuration file schema > ui-defaults > job_view_nodestats_selectedMetrics - 26.14. Property
cc-backend configuration file schema > ui-defaults > job_view_selectedMetrics - 26.15. Property
cc-backend configuration file schema > ui-defaults > plot_general_colorscheme - 26.16. Property
cc-backend configuration file schema > ui-defaults > plot_list_selectedMetrics
- 26.1. Property
Title: cc-backend configuration file schema
| Type | object |
| Required | No |
| Additional properties | Any type allowed |
| Property | Pattern | Type | Deprecated | Definition | Title/Description |
|---|---|---|---|---|---|
| - addr | No | string | No | - | Address where the http (or https) server will listen on (for example: ’localhost:80’). |
| - apiAllowedIPs | No | array of string | No | - | Addresses from which secured API endpoints can be reached |
| - user | No | string | No | - | Drop root permissions once .env was read and the port was taken. Only applicable if using privileged port. |
| - group | No | string | No | - | Drop root permissions once .env was read and the port was taken. Only applicable if using privileged port. |
| - disable-authentication | No | boolean | No | - | Disable authentication (for everything: API, Web-UI, …). |
| - embed-static-files | No | boolean | No | - | If all files in `web/frontend/public` should be served from within the binary itself (they are embedded) or not. |
| - static-files | No | string | No | - | Folder where static assets can be found, if embed-static-files is false. |
| - db-driver | No | enum (of string) | No | - | sqlite3 or mysql (mysql will work for mariadb as well). |
| - db | No | string | No | - | For sqlite3 a filename, for mysql a DSN in this format: https://github.com/go-sql-driver/mysql#dsn-data-source-name (Without query parameters!). |
| - archive | No | object | No | - | Configuration keys for job-archive |
| - disable-archive | No | boolean | No | - | Keep all metric data in the metric data repositories, do not write to the job-archive. |
| - validate | No | boolean | No | - | Validate all input json documents against json schema. |
| - session-max-age | No | string | No | - | Specifies for how long a session shall be valid as a string parsable by time.ParseDuration(). If 0 or empty, the session/token does not expire! |
| - https-cert-file | No | string | No | - | Filepath to SSL certificate. If also https-key-file is set use HTTPS using those certificates. |
| - https-key-file | No | string | No | - | Filepath to SSL key file. If also https-cert-file is set use HTTPS using those certificates. |
| - redirect-http-to | No | string | No | - | If not the empty string and addr does not end in :80, redirect every request incoming at port 80 to that url. |
| - stop-jobs-exceeding-walltime | No | integer | No | - | If not zero, automatically mark jobs as stopped running X seconds longer than their walltime. Only applies if walltime is set for job. |
| - short-running-jobs-duration | No | integer | No | - | Do not show running jobs shorter than X seconds. |
| - emission-constant | No | integer | No | - | . |
| - cron-frequency | No | object | No | - | Frequency of cron job workers. |
| - enable-resampling | No | object | No | - | Enable dynamic zoom in frontend metric plots. |
| + jwts | No | object | No | - | For JWT token authentication. |
| - oidc | No | object | No | - | - |
| - ldap | No | object | No | - | For LDAP Authentication and user synchronisation. |
| + clusters | No | array of object | No | - | Configuration for the clusters to be displayed. |
| - ui-defaults | No | object | No | - | Default configuration for web UI |
1. Property cc-backend configuration file schema > addr
| Type | string |
| Required | No |
Description: Address where the http (or https) server will listen on (for example: ’localhost:80’).
2. Property cc-backend configuration file schema > apiAllowedIPs
| Type | array of string |
| Required | No |
Description: Addresses from which secured API endpoints can be reached
| Array restrictions | |
|---|---|
| Min items | N/A |
| Max items | N/A |
| Items unicity | False |
| Additional items | False |
| Tuple validation | See below |
| Each item of this array must be | Description |
|---|---|
| apiAllowedIPs items | - |
2.1. cc-backend configuration file schema > apiAllowedIPs > apiAllowedIPs items
| Type | string |
| Required | No |
3. Property cc-backend configuration file schema > user
| Type | string |
| Required | No |
Description: Drop root permissions once .env was read and the port was taken. Only applicable if using privileged port.
4. Property cc-backend configuration file schema > group
| Type | string |
| Required | No |
Description: Drop root permissions once .env was read and the port was taken. Only applicable if using privileged port.
5. Property cc-backend configuration file schema > disable-authentication
| Type | boolean |
| Required | No |
Description: Disable authentication (for everything: API, Web-UI, …).
6. Property cc-backend configuration file schema > embed-static-files
| Type | boolean |
| Required | No |
Description: If all files in web/frontend/public should be served from within the binary itself (they are embedded) or not.
7. Property cc-backend configuration file schema > static-files
| Type | string |
| Required | No |
Description: Folder where static assets can be found, if embed-static-files is false.
8. Property cc-backend configuration file schema > db-driver
| Type | enum (of string) |
| Required | No |
Description: sqlite3 or mysql (mysql will work for mariadb as well).
Must be one of:
- “sqlite3”
- “mysql”
9. Property cc-backend configuration file schema > db
| Type | string |
| Required | No |
Description: For sqlite3 a filename, for mysql a DSN in this format: https://github.com/go-sql-driver/mysql#dsn-data-source-name (Without query parameters!).
10. Property cc-backend configuration file schema > archive
| Type | object |
| Required | No |
| Additional properties | Any type allowed |
Description: Configuration keys for job-archive
| Property | Pattern | Type | Deprecated | Definition | Title/Description |
|---|---|---|---|---|---|
| + kind | No | enum (of string) | No | - | Backend type for job-archive |
| - path | No | string | No | - | Path to job archive for file backend |
| - compression | No | integer | No | - | Setup automatic compression for jobs older than number of days |
| - retention | No | object | No | - | Configuration keys for retention |
10.1. Property cc-backend configuration file schema > archive > kind
| Type | enum (of string) |
| Required | Yes |
Description: Backend type for job-archive
Must be one of:
- “file”
- “s3”
10.2. Property cc-backend configuration file schema > archive > path
| Type | string |
| Required | No |
Description: Path to job archive for file backend
10.3. Property cc-backend configuration file schema > archive > compression
| Type | integer |
| Required | No |
Description: Setup automatic compression for jobs older than number of days
10.4. Property cc-backend configuration file schema > archive > retention
| Type | object |
| Required | No |
| Additional properties | Any type allowed |
Description: Configuration keys for retention
| Property | Pattern | Type | Deprecated | Definition | Title/Description |
|---|---|---|---|---|---|
| + policy | No | enum (of string) | No | - | Retention policy |
| - include-db | No | boolean | No | - | Also remove jobs from database |
| - omit-tagged | No | enum (of string) | No | - | Skip tagged jobs from retention |
| - age | No | integer | No | - | Act on jobs with startTime older than age (in days) |
| - location | No | string | No | - | The target directory for retention. Only applicable for retention move. |
10.4.1. Property cc-backend configuration file schema > archive > retention > policy
| Type | enum (of string) |
| Required | Yes |
Description: Retention policy
Must be one of:
- “none”
- “delete”
- “move”
10.4.2. Property cc-backend configuration file schema > archive > retention > include-db
| Type | boolean |
| Required | No |
Description: Also remove jobs from database
10.4.3b. Property cc-backend configuration file schema > archive > retention > omit-tagged
| Type | enum (of string) |
| Required | No |
Description: Control which tagged jobs are excluded from the retention policy.
Must be one of:
"none"— apply retention to all jobs (default)"all"— skip any job that has at least one tag"user"— skip jobs with user-created tags; auto-tagger tags of typeapporjobClassare not considered user tags
10.4.3. Property cc-backend configuration file schema > archive > retention > age
| Type | integer |
| Required | No |
Description: Act on jobs with startTime older than age (in days)
10.4.4. Property cc-backend configuration file schema > archive > retention > location
| Type | string |
| Required | No |
Description: The target directory for retention. Only applicable for retention move.
11. Property cc-backend configuration file schema > disable-archive
| Type | boolean |
| Required | No |
Description: Keep all metric data in the metric data repositories, do not write to the job-archive.
12. Property cc-backend configuration file schema > validate
| Type | boolean |
| Required | No |
Description: Validate all input json documents against json schema.
13. Property cc-backend configuration file schema > session-max-age
| Type | string |
| Required | No |
Description: Specifies for how long a session shall be valid as a string parsable by time.ParseDuration(). If 0 or empty, the session/token does not expire!
14. Property cc-backend configuration file schema > https-cert-file
| Type | string |
| Required | No |
Description: Filepath to SSL certificate. If also https-key-file is set use HTTPS using those certificates.
15. Property cc-backend configuration file schema > https-key-file
| Type | string |
| Required | No |
Description: Filepath to SSL key file. If also https-cert-file is set use HTTPS using those certificates.
16. Property cc-backend configuration file schema > redirect-http-to
| Type | string |
| Required | No |
Description: If not the empty string and addr does not end in :80, redirect every request incoming at port 80 to that url.
17. Property cc-backend configuration file schema > stop-jobs-exceeding-walltime
| Type | integer |
| Required | No |
Description: If not zero, automatically mark jobs as stopped running X seconds longer than their walltime. Only applies if walltime is set for job.
18. Property cc-backend configuration file schema > short-running-jobs-duration
| Type | integer |
| Required | No |
Description: Do not show running jobs shorter than X seconds.
19. Property cc-backend configuration file schema > emission-constant
| Type | integer |
| Required | No |
Description: .
20. Property cc-backend configuration file schema > cron-frequency
| Type | object |
| Required | No |
| Additional properties | Any type allowed |
Description: Frequency of cron job workers.
| Property | Pattern | Type | Deprecated | Definition | Title/Description |
|---|---|---|---|---|---|
| - duration-worker | No | string | No | - | Duration Update Worker [Defaults to ‘5m’] |
| - footprint-worker | No | string | No | - | Metric-Footprint Update Worker [Defaults to ‘10m’] |
20.1. Property cc-backend configuration file schema > cron-frequency > duration-worker
| Type | string |
| Required | No |
Description: Duration Update Worker [Defaults to ‘5m’]
20.2. Property cc-backend configuration file schema > cron-frequency > footprint-worker
| Type | string |
| Required | No |
Description: Metric-Footprint Update Worker [Defaults to ‘10m’]
21. Property cc-backend configuration file schema > enable-resampling
| Type | object |
| Required | No |
| Additional properties | Any type allowed |
Description: Enable dynamic zoom in frontend metric plots.
| Property | Pattern | Type | Deprecated | Definition | Title/Description |
|---|---|---|---|---|---|
| + trigger | No | integer | No | - | Trigger next zoom level at less than this many visible datapoints. |
| + resolutions | No | array of integer | No | - | Array of resampling target resolutions, in seconds. |
21.1. Property cc-backend configuration file schema > enable-resampling > trigger
| Type | integer |
| Required | Yes |
Description: Trigger next zoom level at less than this many visible datapoints.
21.2. Property cc-backend configuration file schema > enable-resampling > resolutions
| Type | array of integer |
| Required | Yes |
Description: Array of resampling target resolutions, in seconds.
| Array restrictions | |
|---|---|
| Min items | N/A |
| Max items | N/A |
| Items unicity | False |
| Additional items | False |
| Tuple validation | See below |
| Each item of this array must be | Description |
|---|---|
| resolutions items | - |
21.2.1. cc-backend configuration file schema > enable-resampling > resolutions > resolutions items
| Type | integer |
| Required | No |
22. Property cc-backend configuration file schema > jwts
| Type | object |
| Required | Yes |
| Additional properties | Any type allowed |
Description: For JWT token authentication.
| Property | Pattern | Type | Deprecated | Definition | Title/Description |
|---|---|---|---|---|---|
| + max-age | No | string | No | - | Configure how long a token is valid. As string parsable by time.ParseDuration() |
| - cookieName | No | string | No | - | Cookie that should be checked for a JWT token. |
| - validateUser | No | boolean | No | - | Deny login for users not in database (but defined in JWT). Overwrite roles in JWT with database roles. |
| - trustedIssuer | No | string | No | - | Issuer that should be accepted when validating external JWTs |
| - syncUserOnLogin | No | boolean | No | - | Add non-existent user to DB at login attempt with values provided in JWT. |
22.1. Property cc-backend configuration file schema > jwts > max-age
| Type | string |
| Required | Yes |
Description: Configure how long a token is valid. As string parsable by time.ParseDuration()
22.2. Property cc-backend configuration file schema > jwts > cookieName
| Type | string |
| Required | No |
Description: Cookie that should be checked for a JWT token.
22.3. Property cc-backend configuration file schema > jwts > validateUser
| Type | boolean |
| Required | No |
Description: Deny login for users not in database (but defined in JWT). Overwrite roles in JWT with database roles.
22.4. Property cc-backend configuration file schema > jwts > trustedIssuer
| Type | string |
| Required | No |
Description: Issuer that should be accepted when validating external JWTs
22.5. Property cc-backend configuration file schema > jwts > syncUserOnLogin
| Type | boolean |
| Required | No |
Description: Add non-existent user to DB at login attempt with values provided in JWT.
23. Property cc-backend configuration file schema > oidc
| Type | object |
| Required | No |
| Additional properties | Any type allowed |
23.1. The following properties are required
- provider
24. Property cc-backend configuration file schema > ldap
| Type | object |
| Required | No |
| Additional properties | Any type allowed |
Description: For LDAP Authentication and user synchronisation.
| Property | Pattern | Type | Deprecated | Definition | Title/Description |
|---|---|---|---|---|---|
| + url | No | string | No | - | URL of LDAP directory server. |
| + user_base | No | string | No | - | Base DN of user tree root. |
| + search_dn | No | string | No | - | DN for authenticating LDAP admin account with general read rights. |
| + user_bind | No | string | No | - | Expression used to authenticate users via LDAP bind. Must contain uid={username}. |
| + user_filter | No | string | No | - | Filter to extract users for syncing. |
| - username_attr | No | string | No | - | Attribute with full username. Default: gecos |
| - sync_interval | No | string | No | - | Interval used for syncing local user table with LDAP directory. Parsed using time.ParseDuration. |
| - sync_del_old_users | No | boolean | No | - | Delete obsolete users in database. |
| - syncUserOnLogin | No | boolean | No | - | Add non-existent user to DB at login attempt if user exists in Ldap directory |
24.1. Property cc-backend configuration file schema > ldap > url
| Type | string |
| Required | Yes |
Description: URL of LDAP directory server.
24.2. Property cc-backend configuration file schema > ldap > user_base
| Type | string |
| Required | Yes |
Description: Base DN of user tree root.
24.3. Property cc-backend configuration file schema > ldap > search_dn
| Type | string |
| Required | Yes |
Description: DN for authenticating LDAP admin account with general read rights.
24.4. Property cc-backend configuration file schema > ldap > user_bind
| Type | string |
| Required | Yes |
Description: Expression used to authenticate users via LDAP bind. Must contain uid={username}.
24.5. Property cc-backend configuration file schema > ldap > user_filter
| Type | string |
| Required | Yes |
Description: Filter to extract users for syncing.
24.6. Property cc-backend configuration file schema > ldap > username_attr
| Type | string |
| Required | No |
Description: Attribute with full username. Default: gecos
24.7. Property cc-backend configuration file schema > ldap > sync_interval
| Type | string |
| Required | No |
Description: Interval used for syncing local user table with LDAP directory. Parsed using time.ParseDuration.
24.8. Property cc-backend configuration file schema > ldap > sync_del_old_users
| Type | boolean |
| Required | No |
Description: Delete obsolete users in database.
24.9. Property cc-backend configuration file schema > ldap > syncUserOnLogin
| Type | boolean |
| Required | No |
Description: Add non-existent user to DB at login attempt if user exists in Ldap directory
25. Property cc-backend configuration file schema > clusters
| Type | array of object |
| Required | Yes |
Description: Configuration for the clusters to be displayed.
| Array restrictions | |
|---|---|
| Min items | N/A |
| Max items | N/A |
| Items unicity | False |
| Additional items | False |
| Tuple validation | See below |
| Each item of this array must be | Description |
|---|---|
| clusters items | - |
25.1. cc-backend configuration file schema > clusters > clusters items
| Type | object |
| Required | No |
| Additional properties | Any type allowed |
| Property | Pattern | Type | Deprecated | Definition | Title/Description |
|---|---|---|---|---|---|
| + name | No | string | No | - | The name of the cluster. |
| + metricDataRepository | No | object | No | - | Type of the metric data repository for this cluster |
| + filterRanges | No | object | No | - | This option controls the slider ranges for the UI controls of numNodes, duration, and startTime. |
25.1.1. Property cc-backend configuration file schema > clusters > clusters items > name
| Type | string |
| Required | Yes |
Description: The name of the cluster.
25.1.2. Property cc-backend configuration file schema > clusters > clusters items > metricDataRepository
| Type | object |
| Required | Yes |
| Additional properties | Any type allowed |
Description: Type of the metric data repository for this cluster
| Property | Pattern | Type | Deprecated | Definition | Title/Description |
|---|---|---|---|---|---|
| + kind | No | enum (of string) | No | - | - |
| + url | No | string | No | - | - |
| - token | No | string | No | - | - |
25.1.2.1. Property cc-backend configuration file schema > clusters > clusters items > metricDataRepository > kind
| Type | enum (of string) |
| Required | Yes |
Must be one of:
- “influxdb”
- “prometheus”
- “cc-metric-store”
- “test”
25.1.2.2. Property cc-backend configuration file schema > clusters > clusters items > metricDataRepository > url
| Type | string |
| Required | Yes |
25.1.2.3. Property cc-backend configuration file schema > clusters > clusters items > metricDataRepository > token
| Type | string |
| Required | No |
25.1.3. Property cc-backend configuration file schema > clusters > clusters items > filterRanges
| Type | object |
| Required | Yes |
| Additional properties | Any type allowed |
Description: This option controls the slider ranges for the UI controls of numNodes, duration, and startTime.
| Property | Pattern | Type | Deprecated | Definition | Title/Description |
|---|---|---|---|---|---|
| + numNodes | No | object | No | - | UI slider range for number of nodes |
| + duration | No | object | No | - | UI slider range for duration |
| + startTime | No | object | No | - | UI slider range for start time |
25.1.3.1. Property cc-backend configuration file schema > clusters > clusters items > filterRanges > numNodes
| Type | object |
| Required | Yes |
| Additional properties | Any type allowed |
Description: UI slider range for number of nodes
| Property | Pattern | Type | Deprecated | Definition | Title/Description |
|---|---|---|---|---|---|
| + from | No | integer | No | - | - |
| + to | No | integer | No | - | - |
25.1.3.1.1. Property cc-backend configuration file schema > clusters > clusters items > filterRanges > numNodes > from
| Type | integer |
| Required | Yes |
25.1.3.1.2. Property cc-backend configuration file schema > clusters > clusters items > filterRanges > numNodes > to
| Type | integer |
| Required | Yes |
25.1.3.2. Property cc-backend configuration file schema > clusters > clusters items > filterRanges > duration
| Type | object |
| Required | Yes |
| Additional properties | Any type allowed |
Description: UI slider range for duration
| Property | Pattern | Type | Deprecated | Definition | Title/Description |
|---|---|---|---|---|---|
| + from | No | integer | No | - | - |
| + to | No | integer | No | - | - |
25.1.3.2.1. Property cc-backend configuration file schema > clusters > clusters items > filterRanges > duration > from
| Type | integer |
| Required | Yes |
25.1.3.2.2. Property cc-backend configuration file schema > clusters > clusters items > filterRanges > duration > to
| Type | integer |
| Required | Yes |
25.1.3.3. Property cc-backend configuration file schema > clusters > clusters items > filterRanges > startTime
| Type | object |
| Required | Yes |
| Additional properties | Any type allowed |
Description: UI slider range for start time
| Property | Pattern | Type | Deprecated | Definition | Title/Description |
|---|---|---|---|---|---|
| + from | No | string | No | - | - |
| + to | No | null | No | - | - |
25.1.3.3.1. Property cc-backend configuration file schema > clusters > clusters items > filterRanges > startTime > from
| Type | string |
| Required | Yes |
| Format | date-time |
25.1.3.3.2. Property cc-backend configuration file schema > clusters > clusters items > filterRanges > startTime > to
| Type | null |
| Required | Yes |
26. Property cc-backend configuration file schema > ui-defaults
| Type | object |
| Required | No |
| Additional properties | Any type allowed |
Description: Default configuration for web UI
| Property | Pattern | Type | Deprecated | Definition | Title/Description |
|---|---|---|---|---|---|
| + plot_general_colorBackground | No | boolean | No | - | Color plot background according to job average threshold limits |
| + plot_general_lineWidth | No | integer | No | - | Initial linewidth |
| + plot_list_jobsPerPage | No | integer | No | - | Jobs shown per page in job lists |
| + plot_view_plotsPerRow | No | integer | No | - | Number of plots per row in single job view |
| + plot_view_showPolarplot | No | boolean | No | - | Option to toggle polar plot in single job view |
| + plot_view_showRoofline | No | boolean | No | - | Option to toggle roofline plot in single job view |
| + plot_view_showStatTable | No | boolean | No | - | Option to toggle the node statistic table in single job view |
| + system_view_selectedMetric | No | string | No | - | Initial metric shown in system view |
| + job_view_showFootprint | No | boolean | No | - | Option to toggle footprint ui in single job view |
| + job_list_usePaging | No | boolean | No | - | Option to switch from continous scroll to paging |
| + analysis_view_histogramMetrics | No | array of string | No | - | Metrics to show as job count histograms in analysis view |
| + analysis_view_scatterPlotMetrics | No | array of array | No | - | Initial scatter plto configuration in analysis view |
| + job_view_nodestats_selectedMetrics | No | array of string | No | - | Initial metrics shown in node statistics table of single job view |
| + job_view_selectedMetrics | No | array of string | No | - | - |
| + plot_general_colorscheme | No | array of string | No | - | Initial color scheme |
| + plot_list_selectedMetrics | No | array of string | No | - | Initial metric plots shown in jobs lists |
26.1. Property cc-backend configuration file schema > ui-defaults > plot_general_colorBackground
| Type | boolean |
| Required | Yes |
Description: Color plot background according to job average threshold limits
26.2. Property cc-backend configuration file schema > ui-defaults > plot_general_lineWidth
| Type | integer |
| Required | Yes |
Description: Initial linewidth
26.3. Property cc-backend configuration file schema > ui-defaults > plot_list_jobsPerPage
| Type | integer |
| Required | Yes |
Description: Jobs shown per page in job lists
26.4. Property cc-backend configuration file schema > ui-defaults > plot_view_plotsPerRow
| Type | integer |
| Required | Yes |
Description: Number of plots per row in single job view
26.5. Property cc-backend configuration file schema > ui-defaults > plot_view_showPolarplot
| Type | boolean |
| Required | Yes |
Description: Option to toggle polar plot in single job view
26.6. Property cc-backend configuration file schema > ui-defaults > plot_view_showRoofline
| Type | boolean |
| Required | Yes |
Description: Option to toggle roofline plot in single job view
26.7. Property cc-backend configuration file schema > ui-defaults > plot_view_showStatTable
| Type | boolean |
| Required | Yes |
Description: Option to toggle the node statistic table in single job view
26.8. Property cc-backend configuration file schema > ui-defaults > system_view_selectedMetric
| Type | string |
| Required | Yes |
Description: Initial metric shown in system view
26.9. Property cc-backend configuration file schema > ui-defaults > job_view_showFootprint
| Type | boolean |
| Required | Yes |
Description: Option to toggle footprint ui in single job view
26.10. Property cc-backend configuration file schema > ui-defaults > job_list_usePaging
| Type | boolean |
| Required | Yes |
Description: Option to switch from continous scroll to paging
26.11. Property cc-backend configuration file schema > ui-defaults > analysis_view_histogramMetrics
| Type | array of string |
| Required | Yes |
Description: Metrics to show as job count histograms in analysis view
| Array restrictions | |
|---|---|
| Min items | N/A |
| Max items | N/A |
| Items unicity | False |
| Additional items | False |
| Tuple validation | See below |
| Each item of this array must be | Description |
|---|---|
| analysis_view_histogramMetrics items | - |
26.11.1. cc-backend configuration file schema > ui-defaults > analysis_view_histogramMetrics > analysis_view_histogramMetrics items
| Type | string |
| Required | No |
26.12. Property cc-backend configuration file schema > ui-defaults > analysis_view_scatterPlotMetrics
| Type | array of array |
| Required | Yes |
Description: Initial scatter plto configuration in analysis view
| Array restrictions | |
|---|---|
| Min items | N/A |
| Max items | N/A |
| Items unicity | False |
| Additional items | False |
| Tuple validation | See below |
| Each item of this array must be | Description |
|---|---|
| analysis_view_scatterPlotMetrics items | - |
26.12.1. cc-backend configuration file schema > ui-defaults > analysis_view_scatterPlotMetrics > analysis_view_scatterPlotMetrics items
| Type | array of string |
| Required | No |
| Array restrictions | |
|---|---|
| Min items | 1 |
| Max items | N/A |
| Items unicity | False |
| Additional items | False |
| Tuple validation | See below |
| Each item of this array must be | Description |
|---|---|
| analysis_view_scatterPlotMetrics items items | - |
26.12.1.1. cc-backend configuration file schema > ui-defaults > analysis_view_scatterPlotMetrics > analysis_view_scatterPlotMetrics items > analysis_view_scatterPlotMetrics items items
| Type | string |
| Required | No |
26.13. Property cc-backend configuration file schema > ui-defaults > job_view_nodestats_selectedMetrics
| Type | array of string |
| Required | Yes |
Description: Initial metrics shown in node statistics table of single job view
| Array restrictions | |
|---|---|
| Min items | N/A |
| Max items | N/A |
| Items unicity | False |
| Additional items | False |
| Tuple validation | See below |
| Each item of this array must be | Description |
|---|---|
| job_view_nodestats_selectedMetrics items | - |
26.13.1. cc-backend configuration file schema > ui-defaults > job_view_nodestats_selectedMetrics > job_view_nodestats_selectedMetrics items
| Type | string |
| Required | No |
26.14. Property cc-backend configuration file schema > ui-defaults > job_view_selectedMetrics
| Type | array of string |
| Required | Yes |
| Array restrictions | |
|---|---|
| Min items | N/A |
| Max items | N/A |
| Items unicity | False |
| Additional items | False |
| Tuple validation | See below |
| Each item of this array must be | Description |
|---|---|
| job_view_selectedMetrics items | - |
26.14.1. cc-backend configuration file schema > ui-defaults > job_view_selectedMetrics > job_view_selectedMetrics items
| Type | string |
| Required | No |
26.15. Property cc-backend configuration file schema > ui-defaults > plot_general_colorscheme
| Type | array of string |
| Required | Yes |
Description: Initial color scheme
| Array restrictions | |
|---|---|
| Min items | N/A |
| Max items | N/A |
| Items unicity | False |
| Additional items | False |
| Tuple validation | See below |
| Each item of this array must be | Description |
|---|---|
| plot_general_colorscheme items | - |
26.15.1. cc-backend configuration file schema > ui-defaults > plot_general_colorscheme > plot_general_colorscheme items
| Type | string |
| Required | No |
26.16. Property cc-backend configuration file schema > ui-defaults > plot_list_selectedMetrics
| Type | array of string |
| Required | Yes |
Description: Initial metric plots shown in jobs lists
| Array restrictions | |
|---|---|
| Min items | N/A |
| Max items | N/A |
| Items unicity | False |
| Additional items | False |
| Tuple validation | See below |
| Each item of this array must be | Description |
|---|---|
| plot_list_selectedMetrics items | - |
26.16.1. cc-backend configuration file schema > ui-defaults > plot_list_selectedMetrics > plot_list_selectedMetrics items
| Type | string |
| Required | No |
Generated using json-schema-for-humans on 2024-12-04 at 16:45:59 +0100
7.1.7.2 - Cluster Schema
The following schema in its raw form can be found in the ClusterCockpit GitHub repository.
Manual Updates
Changes to the original JSON schema found in the repository are not automatically rendered in this reference documentation.Last Update: 04.12.2024HPC cluster description
- 1. Property
HPC cluster description > name - 2. Property
HPC cluster description > metricConfig- 2.1. HPC cluster description > metricConfig > metricConfig items
- 2.1.1. Property
HPC cluster description > metricConfig > metricConfig items > name - 2.1.2. Property
HPC cluster description > metricConfig > metricConfig items > unit - 2.1.3. Property
HPC cluster description > metricConfig > metricConfig items > scope - 2.1.4. Property
HPC cluster description > metricConfig > metricConfig items > timestep - 2.1.5. Property
HPC cluster description > metricConfig > metricConfig items > aggregation - 2.1.6. Property
HPC cluster description > metricConfig > metricConfig items > footprint - 2.1.7. Property
HPC cluster description > metricConfig > metricConfig items > energy - 2.1.8. Property
HPC cluster description > metricConfig > metricConfig items > lowerIsBetter - 2.1.9. Property
HPC cluster description > metricConfig > metricConfig items > peak - 2.1.10. Property
HPC cluster description > metricConfig > metricConfig items > normal - 2.1.11. Property
HPC cluster description > metricConfig > metricConfig items > caution - 2.1.12. Property
HPC cluster description > metricConfig > metricConfig items > alert - 2.1.13. Property
HPC cluster description > metricConfig > metricConfig items > subClusters- 2.1.13.1. HPC cluster description > metricConfig > metricConfig items > subClusters > subClusters items
- 2.1.13.1.1. Property
HPC cluster description > metricConfig > metricConfig items > subClusters > subClusters items > name - 2.1.13.1.2. Property
HPC cluster description > metricConfig > metricConfig items > subClusters > subClusters items > footprint - 2.1.13.1.3. Property
HPC cluster description > metricConfig > metricConfig items > subClusters > subClusters items > energy - 2.1.13.1.4. Property
HPC cluster description > metricConfig > metricConfig items > subClusters > subClusters items > lowerIsBetter - 2.1.13.1.5. Property
HPC cluster description > metricConfig > metricConfig items > subClusters > subClusters items > peak - 2.1.13.1.6. Property
HPC cluster description > metricConfig > metricConfig items > subClusters > subClusters items > normal - 2.1.13.1.7. Property
HPC cluster description > metricConfig > metricConfig items > subClusters > subClusters items > caution - 2.1.13.1.8. Property
HPC cluster description > metricConfig > metricConfig items > subClusters > subClusters items > alert - 2.1.13.1.9. Property
HPC cluster description > metricConfig > metricConfig items > subClusters > subClusters items > remove
- 2.1.13.1.1. Property
- 2.1.13.1. HPC cluster description > metricConfig > metricConfig items > subClusters > subClusters items
- 2.1.1. Property
- 2.1. HPC cluster description > metricConfig > metricConfig items
- 3. Property
HPC cluster description > subClusters- 3.1. HPC cluster description > subClusters > subClusters items
- 3.1.1. Property
HPC cluster description > subClusters > subClusters items > name - 3.1.2. Property
HPC cluster description > subClusters > subClusters items > processorType - 3.1.3. Property
HPC cluster description > subClusters > subClusters items > socketsPerNode - 3.1.4. Property
HPC cluster description > subClusters > subClusters items > coresPerSocket - 3.1.5. Property
HPC cluster description > subClusters > subClusters items > threadsPerCore - 3.1.6. Property
HPC cluster description > subClusters > subClusters items > flopRateScalar - 3.1.7. Property
HPC cluster description > subClusters > subClusters items > flopRateSimd - 3.1.8. Property
HPC cluster description > subClusters > subClusters items > memoryBandwidth - 3.1.9. Property
HPC cluster description > subClusters > subClusters items > nodes - 3.1.10. Property
HPC cluster description > subClusters > subClusters items > topology- 3.1.10.1. Property
HPC cluster description > subClusters > subClusters items > topology > node - 3.1.10.2. Property
HPC cluster description > subClusters > subClusters items > topology > socket - 3.1.10.3. Property
HPC cluster description > subClusters > subClusters items > topology > memoryDomain - 3.1.10.4. Property
HPC cluster description > subClusters > subClusters items > topology > die - 3.1.10.5. Property
HPC cluster description > subClusters > subClusters items > topology > core - 3.1.10.6. Property
HPC cluster description > subClusters > subClusters items > topology > accelerators- 3.1.10.6.1. HPC cluster description > subClusters > subClusters items > topology > accelerators > accelerators items
- 3.1.10.6.1.1. Property
HPC cluster description > subClusters > subClusters items > topology > accelerators > accelerators items > id - 3.1.10.6.1.2. Property
HPC cluster description > subClusters > subClusters items > topology > accelerators > accelerators items > type - 3.1.10.6.1.3. Property
HPC cluster description > subClusters > subClusters items > topology > accelerators > accelerators items > model
- 3.1.10.6.1.1. Property
- 3.1.10.6.1. HPC cluster description > subClusters > subClusters items > topology > accelerators > accelerators items
- 3.1.10.1. Property
- 3.1.1. Property
- 3.1. HPC cluster description > subClusters > subClusters items
Title: HPC cluster description
| Type | object |
| Required | No |
| Additional properties | Any type allowed |
Description: Meta data information of a HPC cluster
| Property | Pattern | Type | Deprecated | Definition | Title/Description |
|---|---|---|---|---|---|
| + name | No | string | No | - | The unique identifier of a cluster |
| + metricConfig | No | array of object | No | - | Metric specifications |
| + subClusters | No | array of object | No | - | Array of cluster hardware partitions |
1. Property HPC cluster description > name
| Type | string |
| Required | Yes |
Description: The unique identifier of a cluster
2. Property HPC cluster description > metricConfig
| Type | array of object |
| Required | Yes |
Description: Metric specifications
| Array restrictions | |
|---|---|
| Min items | 1 |
| Max items | N/A |
| Items unicity | False |
| Additional items | False |
| Tuple validation | See below |
| Each item of this array must be | Description |
|---|---|
| metricConfig items | - |
2.1. HPC cluster description > metricConfig > metricConfig items
| Type | object |
| Required | No |
| Additional properties | Any type allowed |
| Property | Pattern | Type | Deprecated | Definition | Title/Description |
|---|---|---|---|---|---|
| + name | No | string | No | - | Metric name |
| + unit | No | object | No | In embedfs://unit.schema.json | Metric unit |
| + scope | No | string | No | - | Native measurement resolution |
| + timestep | No | integer | No | - | Frequency of timeseries points |
| + aggregation | No | enum (of string) | No | - | How the metric is aggregated |
| - footprint | No | enum (of string) | No | - | Is it a footprint metric and what type |
| - energy | No | enum (of string) | No | - | Is it used to calculate job energy |
| - lowerIsBetter | No | boolean | No | - | Is lower better. |
| + peak | No | number | No | - | Metric peak threshold (Upper metric limit) |
| + normal | No | number | No | - | Metric normal threshold |
| + caution | No | number | No | - | Metric caution threshold (Suspicious but does not require immediate action) |
| + alert | No | number | No | - | Metric alert threshold (Requires immediate action) |
| - subClusters | No | array of object | No | - | Array of cluster hardware partition metric thresholds |
2.1.1. Property HPC cluster description > metricConfig > metricConfig items > name
| Type | string |
| Required | Yes |
Description: Metric name
2.1.2. Property HPC cluster description > metricConfig > metricConfig items > unit
| Type | object |
| Required | Yes |
| Additional properties | Any type allowed |
| Defined in | embedfs://unit.schema.json |
Description: Metric unit
2.1.3. Property HPC cluster description > metricConfig > metricConfig items > scope
| Type | string |
| Required | Yes |
Description: Native measurement resolution
2.1.4. Property HPC cluster description > metricConfig > metricConfig items > timestep
| Type | integer |
| Required | Yes |
Description: Frequency of timeseries points
2.1.5. Property HPC cluster description > metricConfig > metricConfig items > aggregation
| Type | enum (of string) |
| Required | Yes |
Description: How the metric is aggregated
Must be one of:
- “sum”
- “avg”
2.1.6. Property HPC cluster description > metricConfig > metricConfig items > footprint
| Type | enum (of string) |
| Required | No |
Description: Is it a footprint metric and what type
Must be one of:
- “avg”
- “max”
- “min”
2.1.7. Property HPC cluster description > metricConfig > metricConfig items > energy
| Type | enum (of string) |
| Required | No |
Description: Is it used to calculate job energy
Must be one of:
- “power”
- “energy”
2.1.8. Property HPC cluster description > metricConfig > metricConfig items > lowerIsBetter
| Type | boolean |
| Required | No |
Description: Is lower better.
2.1.9. Property HPC cluster description > metricConfig > metricConfig items > peak
| Type | number |
| Required | Yes |
Description: Metric peak threshold (Upper metric limit)
2.1.10. Property HPC cluster description > metricConfig > metricConfig items > normal
| Type | number |
| Required | Yes |
Description: Metric normal threshold
2.1.11. Property HPC cluster description > metricConfig > metricConfig items > caution
| Type | number |
| Required | Yes |
Description: Metric caution threshold (Suspicious but does not require immediate action)
2.1.12. Property HPC cluster description > metricConfig > metricConfig items > alert
| Type | number |
| Required | Yes |
Description: Metric alert threshold (Requires immediate action)
2.1.13. Property HPC cluster description > metricConfig > metricConfig items > subClusters
| Type | array of object |
| Required | No |
Description: Array of cluster hardware partition metric thresholds
| Array restrictions | |
|---|---|
| Min items | N/A |
| Max items | N/A |
| Items unicity | False |
| Additional items | False |
| Tuple validation | See below |
| Each item of this array must be | Description |
|---|---|
| subClusters items | - |
2.1.13.1. HPC cluster description > metricConfig > metricConfig items > subClusters > subClusters items
| Type | object |
| Required | No |
| Additional properties | Any type allowed |
| Property | Pattern | Type | Deprecated | Definition | Title/Description |
|---|---|---|---|---|---|
| + name | No | string | No | - | Hardware partition name |
| - footprint | No | enum (of string) | No | - | Is it a footprint metric and what type. Overwrite global setting |
| - energy | No | enum (of string) | No | - | Is it used to calculate job energy. Overwrite global |
| - lowerIsBetter | No | boolean | No | - | Is lower better. Overwrite global |
| - peak | No | number | No | - | - |
| - normal | No | number | No | - | - |
| - caution | No | number | No | - | - |
| - alert | No | number | No | - | - |
| - remove | No | boolean | No | - | Remove this metric for this subcluster |
2.1.13.1.1. Property HPC cluster description > metricConfig > metricConfig items > subClusters > subClusters items > name
| Type | string |
| Required | Yes |
Description: Hardware partition name
2.1.13.1.2. Property HPC cluster description > metricConfig > metricConfig items > subClusters > subClusters items > footprint
| Type | enum (of string) |
| Required | No |
Description: Is it a footprint metric and what type. Overwrite global setting
Must be one of:
- “avg”
- “max”
- “min”
2.1.13.1.3. Property HPC cluster description > metricConfig > metricConfig items > subClusters > subClusters items > energy
| Type | enum (of string) |
| Required | No |
Description: Is it used to calculate job energy. Overwrite global
Must be one of:
- “power”
- “energy”
2.1.13.1.4. Property HPC cluster description > metricConfig > metricConfig items > subClusters > subClusters items > lowerIsBetter
| Type | boolean |
| Required | No |
Description: Is lower better. Overwrite global
2.1.13.1.5. Property HPC cluster description > metricConfig > metricConfig items > subClusters > subClusters items > peak
| Type | number |
| Required | No |
2.1.13.1.6. Property HPC cluster description > metricConfig > metricConfig items > subClusters > subClusters items > normal
| Type | number |
| Required | No |
2.1.13.1.7. Property HPC cluster description > metricConfig > metricConfig items > subClusters > subClusters items > caution
| Type | number |
| Required | No |
2.1.13.1.8. Property HPC cluster description > metricConfig > metricConfig items > subClusters > subClusters items > alert
| Type | number |
| Required | No |
2.1.13.1.9. Property HPC cluster description > metricConfig > metricConfig items > subClusters > subClusters items > remove
| Type | boolean |
| Required | No |
Description: Remove this metric for this subcluster
3. Property HPC cluster description > subClusters
| Type | array of object |
| Required | Yes |
Description: Array of cluster hardware partitions
| Array restrictions | |
|---|---|
| Min items | 1 |
| Max items | N/A |
| Items unicity | False |
| Additional items | False |
| Tuple validation | See below |
| Each item of this array must be | Description |
|---|---|
| subClusters items | - |
3.1. HPC cluster description > subClusters > subClusters items
| Type | object |
| Required | No |
| Additional properties | Any type allowed |
| Property | Pattern | Type | Deprecated | Definition | Title/Description |
|---|---|---|---|---|---|
| + name | No | string | No | - | Hardware partition name |
| + processorType | No | string | No | - | Processor type |
| + socketsPerNode | No | integer | No | - | Number of sockets per node |
| + coresPerSocket | No | integer | No | - | Number of cores per socket |
| + threadsPerCore | No | integer | No | - | Number of SMT threads per core |
| + flopRateScalar | No | object | No | - | Theoretical node peak flop rate for scalar code in GFlops/s |
| + flopRateSimd | No | object | No | - | Theoretical node peak flop rate for SIMD code in GFlops/s |
| + memoryBandwidth | No | object | No | - | Theoretical node peak memory bandwidth in GB/s |
| + nodes | No | string | No | - | Node list expression |
| + topology | No | object | No | - | Node topology |
3.1.1. Property HPC cluster description > subClusters > subClusters items > name
| Type | string |
| Required | Yes |
Description: Hardware partition name
3.1.2. Property HPC cluster description > subClusters > subClusters items > processorType
| Type | string |
| Required | Yes |
Description: Processor type
3.1.3. Property HPC cluster description > subClusters > subClusters items > socketsPerNode
| Type | integer |
| Required | Yes |
Description: Number of sockets per node
3.1.4. Property HPC cluster description > subClusters > subClusters items > coresPerSocket
| Type | integer |
| Required | Yes |
Description: Number of cores per socket
3.1.5. Property HPC cluster description > subClusters > subClusters items > threadsPerCore
| Type | integer |
| Required | Yes |
Description: Number of SMT threads per core
3.1.6. Property HPC cluster description > subClusters > subClusters items > flopRateScalar
| Type | object |
| Required | Yes |
| Additional properties | Any type allowed |
Description: Theoretical node peak flop rate for scalar code in GFlops/s
| Property | Pattern | Type | Deprecated | Definition | Title/Description |
|---|---|---|---|---|---|
| - unit | No | object | No | In embedfs://unit.schema.json | Metric unit |
| - value | No | number | No | - | - |
3.1.6.1. Property HPC cluster description > subClusters > subClusters items > flopRateScalar > unit
| Type | object |
| Required | No |
| Additional properties | Any type allowed |
| Defined in | embedfs://unit.schema.json |
Description: Metric unit
3.1.6.2. Property HPC cluster description > subClusters > subClusters items > flopRateScalar > value
| Type | number |
| Required | No |
3.1.7. Property HPC cluster description > subClusters > subClusters items > flopRateSimd
| Type | object |
| Required | Yes |
| Additional properties | Any type allowed |
Description: Theoretical node peak flop rate for SIMD code in GFlops/s
| Property | Pattern | Type | Deprecated | Definition | Title/Description |
|---|---|---|---|---|---|
| - unit | No | object | No | In embedfs://unit.schema.json | Metric unit |
| - value | No | number | No | - | - |
3.1.7.1. Property HPC cluster description > subClusters > subClusters items > flopRateSimd > unit
| Type | object |
| Required | No |
| Additional properties | Any type allowed |
| Defined in | embedfs://unit.schema.json |
Description: Metric unit
3.1.7.2. Property HPC cluster description > subClusters > subClusters items > flopRateSimd > value
| Type | number |
| Required | No |
3.1.8. Property HPC cluster description > subClusters > subClusters items > memoryBandwidth
| Type | object |
| Required | Yes |
| Additional properties | Any type allowed |
Description: Theoretical node peak memory bandwidth in GB/s
| Property | Pattern | Type | Deprecated | Definition | Title/Description |
|---|---|---|---|---|---|
| - unit | No | object | No | In embedfs://unit.schema.json | Metric unit |
| - value | No | number | No | - | - |
3.1.8.1. Property HPC cluster description > subClusters > subClusters items > memoryBandwidth > unit
| Type | object |
| Required | No |
| Additional properties | Any type allowed |
| Defined in | embedfs://unit.schema.json |
Description: Metric unit
3.1.8.2. Property HPC cluster description > subClusters > subClusters items > memoryBandwidth > value
| Type | number |
| Required | No |
3.1.9. Property HPC cluster description > subClusters > subClusters items > nodes
| Type | string |
| Required | Yes |
Description: Node list expression
3.1.10. Property HPC cluster description > subClusters > subClusters items > topology
| Type | object |
| Required | Yes |
| Additional properties | Any type allowed |
Description: Node topology
| Property | Pattern | Type | Deprecated | Definition | Title/Description |
|---|---|---|---|---|---|
| + node | No | array of integer | No | - | HwTread lists of node |
| + socket | No | array of array | No | - | HwTread lists of sockets |
| + memoryDomain | No | array of array | No | - | HwTread lists of memory domains |
| - die | No | array of array | No | - | HwTread lists of dies |
| - core | No | array of array | No | - | HwTread lists of cores |
| - accelerators | No | array of object | No | - | List of of accelerator devices |
3.1.10.1. Property HPC cluster description > subClusters > subClusters items > topology > node
| Type | array of integer |
| Required | Yes |
Description: HwTread lists of node
| Array restrictions | |
|---|---|
| Min items | N/A |
| Max items | N/A |
| Items unicity | False |
| Additional items | False |
| Tuple validation | See below |
| Each item of this array must be | Description |
|---|---|
| node items | - |
3.1.10.1.1. HPC cluster description > subClusters > subClusters items > topology > node > node items
| Type | integer |
| Required | No |
3.1.10.2. Property HPC cluster description > subClusters > subClusters items > topology > socket
| Type | array of array |
| Required | Yes |
Description: HwTread lists of sockets
| Array restrictions | |
|---|---|
| Min items | N/A |
| Max items | N/A |
| Items unicity | False |
| Additional items | False |
| Tuple validation | See below |
| Each item of this array must be | Description |
|---|---|
| socket items | - |
3.1.10.2.1. HPC cluster description > subClusters > subClusters items > topology > socket > socket items
| Type | array of integer |
| Required | No |
| Array restrictions | |
|---|---|
| Min items | N/A |
| Max items | N/A |
| Items unicity | False |
| Additional items | False |
| Tuple validation | See below |
| Each item of this array must be | Description |
|---|---|
| socket items items | - |
3.1.10.2.1.1. HPC cluster description > subClusters > subClusters items > topology > socket > socket items > socket items items
| Type | integer |
| Required | No |
3.1.10.3. Property HPC cluster description > subClusters > subClusters items > topology > memoryDomain
| Type | array of array |
| Required | Yes |
Description: HwTread lists of memory domains
| Array restrictions | |
|---|---|
| Min items | N/A |
| Max items | N/A |
| Items unicity | False |
| Additional items | False |
| Tuple validation | See below |
| Each item of this array must be | Description |
|---|---|
| memoryDomain items | - |
3.1.10.3.1. HPC cluster description > subClusters > subClusters items > topology > memoryDomain > memoryDomain items
| Type | array of integer |
| Required | No |
| Array restrictions | |
|---|---|
| Min items | N/A |
| Max items | N/A |
| Items unicity | False |
| Additional items | False |
| Tuple validation | See below |
| Each item of this array must be | Description |
|---|---|
| memoryDomain items items | - |
3.1.10.3.1.1. HPC cluster description > subClusters > subClusters items > topology > memoryDomain > memoryDomain items > memoryDomain items items
| Type | integer |
| Required | No |
3.1.10.4. Property HPC cluster description > subClusters > subClusters items > topology > die
| Type | array of array |
| Required | No |
Description: HwTread lists of dies
| Array restrictions | |
|---|---|
| Min items | N/A |
| Max items | N/A |
| Items unicity | False |
| Additional items | False |
| Tuple validation | See below |
| Each item of this array must be | Description |
|---|---|
| die items | - |
3.1.10.4.1. HPC cluster description > subClusters > subClusters items > topology > die > die items
| Type | array of integer |
| Required | No |
| Array restrictions | |
|---|---|
| Min items | N/A |
| Max items | N/A |
| Items unicity | False |
| Additional items | False |
| Tuple validation | See below |
| Each item of this array must be | Description |
|---|---|
| die items items | - |
3.1.10.4.1.1. HPC cluster description > subClusters > subClusters items > topology > die > die items > die items items
| Type | integer |
| Required | No |
3.1.10.5. Property HPC cluster description > subClusters > subClusters items > topology > core
| Type | array of array |
| Required | No |
Description: HwTread lists of cores
| Array restrictions | |
|---|---|
| Min items | N/A |
| Max items | N/A |
| Items unicity | False |
| Additional items | False |
| Tuple validation | See below |
| Each item of this array must be | Description |
|---|---|
| core items | - |
3.1.10.5.1. HPC cluster description > subClusters > subClusters items > topology > core > core items
| Type | array of integer |
| Required | No |
| Array restrictions | |
|---|---|
| Min items | N/A |
| Max items | N/A |
| Items unicity | False |
| Additional items | False |
| Tuple validation | See below |
| Each item of this array must be | Description |
|---|---|
| core items items | - |
3.1.10.5.1.1. HPC cluster description > subClusters > subClusters items > topology > core > core items > core items items
| Type | integer |
| Required | No |
3.1.10.6. Property HPC cluster description > subClusters > subClusters items > topology > accelerators
| Type | array of object |
| Required | No |
Description: List of of accelerator devices
| Array restrictions | |
|---|---|
| Min items | N/A |
| Max items | N/A |
| Items unicity | False |
| Additional items | False |
| Tuple validation | See below |
| Each item of this array must be | Description |
|---|---|
| accelerators items | - |
3.1.10.6.1. HPC cluster description > subClusters > subClusters items > topology > accelerators > accelerators items
| Type | object |
| Required | No |
| Additional properties | Any type allowed |
| Property | Pattern | Type | Deprecated | Definition | Title/Description |
|---|---|---|---|---|---|
| + id | No | string | No | - | The unique device id |
| + type | No | enum (of string) | No | - | The accelerator type |
| + model | No | string | No | - | The accelerator model |
3.1.10.6.1.1. Property HPC cluster description > subClusters > subClusters items > topology > accelerators > accelerators items > id
| Type | string |
| Required | Yes |
Description: The unique device id
3.1.10.6.1.2. Property HPC cluster description > subClusters > subClusters items > topology > accelerators > accelerators items > type
| Type | enum (of string) |
| Required | Yes |
Description: The accelerator type
Must be one of:
- “Nvidia GPU”
- “AMD GPU”
- “Intel GPU”
3.1.10.6.1.3. Property HPC cluster description > subClusters > subClusters items > topology > accelerators > accelerators items > model
| Type | string |
| Required | Yes |
Description: The accelerator model
Generated using json-schema-for-humans on 2024-12-04 at 16:45:59 +0100
7.1.7.3 - Job Data Schema
The following schema in its raw form can be found in the ClusterCockpit GitHub repository.
Manual Updates
Changes to the original JSON schema found in the repository are not automatically rendered in this reference documentation.Last Update: 04.12.2024Job metric data list
- 1. Property
Job metric data list > mem_used - 2. Property
Job metric data list > flops_any - 3. Property
Job metric data list > mem_bw - 4. Property
Job metric data list > net_bw - 5. Property
Job metric data list > ipc - 6. Property
Job metric data list > cpu_user - 7. Property
Job metric data list > cpu_load - 8. Property
Job metric data list > flops_dp - 9. Property
Job metric data list > flops_sp - 10. Property
Job metric data list > vectorization_ratio- 10.1. Property
Job metric data list > vectorization_ratio > node - 10.2. Property
Job metric data list > vectorization_ratio > socket - 10.3. Property
Job metric data list > vectorization_ratio > memoryDomain - 10.4. Property
Job metric data list > vectorization_ratio > core - 10.5. Property
Job metric data list > vectorization_ratio > hwthread
- 10.1. Property
- 11. Property
Job metric data list > cpu_power - 12. Property
Job metric data list > mem_power - 13. Property
Job metric data list > acc_utilization - 14. Property
Job metric data list > acc_mem_used - 15. Property
Job metric data list > acc_power - 16. Property
Job metric data list > clock - 17. Property
Job metric data list > eth_read_bw - 18. Property
Job metric data list > eth_write_bw - 19. Property
Job metric data list > filesystems- 19.1. Job metric data list > filesystems > filesystems items
- 19.1.1. Property
Job metric data list > filesystems > filesystems items > name - 19.1.2. Property
Job metric data list > filesystems > filesystems items > type - 19.1.3. Property
Job metric data list > filesystems > filesystems items > read_bw - 19.1.4. Property
Job metric data list > filesystems > filesystems items > write_bw - 19.1.5. Property
Job metric data list > filesystems > filesystems items > read_req - 19.1.6. Property
Job metric data list > filesystems > filesystems items > write_req - 19.1.7. Property
Job metric data list > filesystems > filesystems items > inodes - 19.1.8. Property
Job metric data list > filesystems > filesystems items > accesses - 19.1.9. Property
Job metric data list > filesystems > filesystems items > fsync - 19.1.10. Property
Job metric data list > filesystems > filesystems items > create - 19.1.11. Property
Job metric data list > filesystems > filesystems items > open - 19.1.12. Property
Job metric data list > filesystems > filesystems items > close - 19.1.13. Property
Job metric data list > filesystems > filesystems items > seek
- 19.1.1. Property
- 19.1. Job metric data list > filesystems > filesystems items
Title: Job metric data list
| Type | object |
| Required | No |
| Additional properties | Any type allowed |
Description: Collection of metric data of a HPC job
| Property | Pattern | Type | Deprecated | Definition | Title/Description |
|---|---|---|---|---|---|
| + mem_used | No | object | No | - | Memory capacity used |
| + flops_any | No | object | No | - | Total flop rate with DP flops scaled up |
| + mem_bw | No | object | No | - | Main memory bandwidth |
| + net_bw | No | object | No | - | Total fast interconnect network bandwidth |
| - ipc | No | object | No | - | Instructions executed per cycle |
| + cpu_user | No | object | No | - | CPU user active core utilization |
| + cpu_load | No | object | No | - | CPU requested core utilization (load 1m) |
| - flops_dp | No | object | No | - | Double precision flop rate |
| - flops_sp | No | object | No | - | Single precision flops rate |
| - vectorization_ratio | No | object | No | - | Fraction of arithmetic instructions using SIMD instructions |
| - cpu_power | No | object | No | - | CPU power consumption |
| - mem_power | No | object | No | - | Memory power consumption |
| - acc_utilization | No | object | No | - | GPU utilization |
| - acc_mem_used | No | object | No | - | GPU memory capacity used |
| - acc_power | No | object | No | - | GPU power consumption |
| - clock | No | object | No | - | Average core frequency |
| - eth_read_bw | No | object | No | - | Ethernet read bandwidth |
| - eth_write_bw | No | object | No | - | Ethernet write bandwidth |
| + filesystems | No | array of object | No | - | Array of filesystems |
1. Property Job metric data list > mem_used
| Type | object |
| Required | Yes |
| Additional properties | Any type allowed |
Description: Memory capacity used
| Property | Pattern | Type | Deprecated | Definition | Title/Description |
|---|---|---|---|---|---|
| + node | No | object | No | In embedfs://job-metric-data.schema.json | 😅 ERROR in schema generation, a referenced schema could not be loaded, no documentation here unfortunately 🏜️ |
1.1. Property Job metric data list > mem_used > node
| Type | object |
| Required | Yes |
| Additional properties | Any type allowed |
| Defined in | embedfs://job-metric-data.schema.json |
Description: 😅 ERROR in schema generation, a referenced schema could not be loaded, no documentation here unfortunately 🏜️
2. Property Job metric data list > flops_any
| Type | object |
| Required | Yes |
| Additional properties | Any type allowed |
Description: Total flop rate with DP flops scaled up
| Property | Pattern | Type | Deprecated | Definition | Title/Description |
|---|---|---|---|---|---|
| - node | No | object | No | In embedfs://job-metric-data.schema.json | 😅 ERROR in schema generation, a referenced schema could not be loaded, no documentation here unfortunately 🏜️ |
| - socket | No | object | No | In embedfs://job-metric-data.schema.json | 😅 ERROR in schema generation, a referenced schema could not be loaded, no documentation here unfortunately 🏜️ |
| - memoryDomain | No | object | No | In embedfs://job-metric-data.schema.json | 😅 ERROR in schema generation, a referenced schema could not be loaded, no documentation here unfortunately 🏜️ |
| - core | No | object | No | In embedfs://job-metric-data.schema.json | 😅 ERROR in schema generation, a referenced schema could not be loaded, no documentation here unfortunately 🏜️ |
| - hwthread | No | object | No | In embedfs://job-metric-data.schema.json | 😅 ERROR in schema generation, a referenced schema could not be loaded, no documentation here unfortunately 🏜️ |
2.1. Property Job metric data list > flops_any > node
| Type | object |
| Required | No |
| Additional properties | Any type allowed |
| Defined in | embedfs://job-metric-data.schema.json |
Description: 😅 ERROR in schema generation, a referenced schema could not be loaded, no documentation here unfortunately 🏜️
2.2. Property Job metric data list > flops_any > socket
| Type | object |
| Required | No |
| Additional properties | Any type allowed |
| Defined in | embedfs://job-metric-data.schema.json |
Description: 😅 ERROR in schema generation, a referenced schema could not be loaded, no documentation here unfortunately 🏜️
2.3. Property Job metric data list > flops_any > memoryDomain
| Type | object |
| Required | No |
| Additional properties | Any type allowed |
| Defined in | embedfs://job-metric-data.schema.json |
Description: 😅 ERROR in schema generation, a referenced schema could not be loaded, no documentation here unfortunately 🏜️
2.4. Property Job metric data list > flops_any > core
| Type | object |
| Required | No |
| Additional properties | Any type allowed |
| Defined in | embedfs://job-metric-data.schema.json |
Description: 😅 ERROR in schema generation, a referenced schema could not be loaded, no documentation here unfortunately 🏜️
2.5. Property Job metric data list > flops_any > hwthread
| Type | object |
| Required | No |
| Additional properties | Any type allowed |
| Defined in | embedfs://job-metric-data.schema.json |
Description: 😅 ERROR in schema generation, a referenced schema could not be loaded, no documentation here unfortunately 🏜️
3. Property Job metric data list > mem_bw
| Type | object |
| Required | Yes |
| Additional properties | Any type allowed |
Description: Main memory bandwidth
| Property | Pattern | Type | Deprecated | Definition | Title/Description |
|---|---|---|---|---|---|
| - node | No | object | No | In embedfs://job-metric-data.schema.json | 😅 ERROR in schema generation, a referenced schema could not be loaded, no documentation here unfortunately 🏜️ |
| - socket | No | object | No | In embedfs://job-metric-data.schema.json | 😅 ERROR in schema generation, a referenced schema could not be loaded, no documentation here unfortunately 🏜️ |
| - memoryDomain | No | object | No | In embedfs://job-metric-data.schema.json | 😅 ERROR in schema generation, a referenced schema could not be loaded, no documentation here unfortunately 🏜️ |
3.1. Property Job metric data list > mem_bw > node
| Type | object |
| Required | No |
| Additional properties | Any type allowed |
| Defined in | embedfs://job-metric-data.schema.json |
Description: 😅 ERROR in schema generation, a referenced schema could not be loaded, no documentation here unfortunately 🏜️
3.2. Property Job metric data list > mem_bw > socket
| Type | object |
| Required | No |
| Additional properties | Any type allowed |
| Defined in | embedfs://job-metric-data.schema.json |
Description: 😅 ERROR in schema generation, a referenced schema could not be loaded, no documentation here unfortunately 🏜️
3.3. Property Job metric data list > mem_bw > memoryDomain
| Type | object |
| Required | No |
| Additional properties | Any type allowed |
| Defined in | embedfs://job-metric-data.schema.json |
Description: 😅 ERROR in schema generation, a referenced schema could not be loaded, no documentation here unfortunately 🏜️
4. Property Job metric data list > net_bw
| Type | object |
| Required | Yes |
| Additional properties | Any type allowed |
Description: Total fast interconnect network bandwidth
| Property | Pattern | Type | Deprecated | Definition | Title/Description |
|---|---|---|---|---|---|
| + node | No | object | No | In embedfs://job-metric-data.schema.json | 😅 ERROR in schema generation, a referenced schema could not be loaded, no documentation here unfortunately 🏜️ |
4.1. Property Job metric data list > net_bw > node
| Type | object |
| Required | Yes |
| Additional properties | Any type allowed |
| Defined in | embedfs://job-metric-data.schema.json |
Description: 😅 ERROR in schema generation, a referenced schema could not be loaded, no documentation here unfortunately 🏜️
5. Property Job metric data list > ipc
| Type | object |
| Required | No |
| Additional properties | Any type allowed |
Description: Instructions executed per cycle
| Property | Pattern | Type | Deprecated | Definition | Title/Description |
|---|---|---|---|---|---|
| - node | No | object | No | In embedfs://job-metric-data.schema.json | 😅 ERROR in schema generation, a referenced schema could not be loaded, no documentation here unfortunately 🏜️ |
| - socket | No | object | No | In embedfs://job-metric-data.schema.json | 😅 ERROR in schema generation, a referenced schema could not be loaded, no documentation here unfortunately 🏜️ |
| - memoryDomain | No | object | No | In embedfs://job-metric-data.schema.json | 😅 ERROR in schema generation, a referenced schema could not be loaded, no documentation here unfortunately 🏜️ |
| - core | No | object | No | In embedfs://job-metric-data.schema.json | 😅 ERROR in schema generation, a referenced schema could not be loaded, no documentation here unfortunately 🏜️ |
| - hwthread | No | object | No | In embedfs://job-metric-data.schema.json | 😅 ERROR in schema generation, a referenced schema could not be loaded, no documentation here unfortunately 🏜️ |
5.1. Property Job metric data list > ipc > node
| Type | object |
| Required | No |
| Additional properties | Any type allowed |
| Defined in | embedfs://job-metric-data.schema.json |
Description: 😅 ERROR in schema generation, a referenced schema could not be loaded, no documentation here unfortunately 🏜️
5.2. Property Job metric data list > ipc > socket
| Type | object |
| Required | No |
| Additional properties | Any type allowed |
| Defined in | embedfs://job-metric-data.schema.json |
Description: 😅 ERROR in schema generation, a referenced schema could not be loaded, no documentation here unfortunately 🏜️
5.3. Property Job metric data list > ipc > memoryDomain
| Type | object |
| Required | No |
| Additional properties | Any type allowed |
| Defined in | embedfs://job-metric-data.schema.json |
Description: 😅 ERROR in schema generation, a referenced schema could not be loaded, no documentation here unfortunately 🏜️
5.4. Property Job metric data list > ipc > core
| Type | object |
| Required | No |
| Additional properties | Any type allowed |
| Defined in | embedfs://job-metric-data.schema.json |
Description: 😅 ERROR in schema generation, a referenced schema could not be loaded, no documentation here unfortunately 🏜️
5.5. Property Job metric data list > ipc > hwthread
| Type | object |
| Required | No |
| Additional properties | Any type allowed |
| Defined in | embedfs://job-metric-data.schema.json |
Description: 😅 ERROR in schema generation, a referenced schema could not be loaded, no documentation here unfortunately 🏜️
6. Property Job metric data list > cpu_user
| Type | object |
| Required | Yes |
| Additional properties | Any type allowed |
Description: CPU user active core utilization
| Property | Pattern | Type | Deprecated | Definition | Title/Description |
|---|---|---|---|---|---|
| - node | No | object | No | In embedfs://job-metric-data.schema.json | 😅 ERROR in schema generation, a referenced schema could not be loaded, no documentation here unfortunately 🏜️ |
| - socket | No | object | No | In embedfs://job-metric-data.schema.json | 😅 ERROR in schema generation, a referenced schema could not be loaded, no documentation here unfortunately 🏜️ |
| - memoryDomain | No | object | No | In embedfs://job-metric-data.schema.json | 😅 ERROR in schema generation, a referenced schema could not be loaded, no documentation here unfortunately 🏜️ |
| - core | No | object | No | In embedfs://job-metric-data.schema.json | 😅 ERROR in schema generation, a referenced schema could not be loaded, no documentation here unfortunately 🏜️ |
| - hwthread | No | object | No | In embedfs://job-metric-data.schema.json | 😅 ERROR in schema generation, a referenced schema could not be loaded, no documentation here unfortunately 🏜️ |
6.1. Property Job metric data list > cpu_user > node
| Type | object |
| Required | No |
| Additional properties | Any type allowed |
| Defined in | embedfs://job-metric-data.schema.json |
Description: 😅 ERROR in schema generation, a referenced schema could not be loaded, no documentation here unfortunately 🏜️
6.2. Property Job metric data list > cpu_user > socket
| Type | object |
| Required | No |
| Additional properties | Any type allowed |
| Defined in | embedfs://job-metric-data.schema.json |
Description: 😅 ERROR in schema generation, a referenced schema could not be loaded, no documentation here unfortunately 🏜️
6.3. Property Job metric data list > cpu_user > memoryDomain
| Type | object |
| Required | No |
| Additional properties | Any type allowed |
| Defined in | embedfs://job-metric-data.schema.json |
Description: 😅 ERROR in schema generation, a referenced schema could not be loaded, no documentation here unfortunately 🏜️
6.4. Property Job metric data list > cpu_user > core
| Type | object |
| Required | No |
| Additional properties | Any type allowed |
| Defined in | embedfs://job-metric-data.schema.json |
Description: 😅 ERROR in schema generation, a referenced schema could not be loaded, no documentation here unfortunately 🏜️
6.5. Property Job metric data list > cpu_user > hwthread
| Type | object |
| Required | No |
| Additional properties | Any type allowed |
| Defined in | embedfs://job-metric-data.schema.json |
Description: 😅 ERROR in schema generation, a referenced schema could not be loaded, no documentation here unfortunately 🏜️
7. Property Job metric data list > cpu_load
| Type | object |
| Required | Yes |
| Additional properties | Any type allowed |
Description: CPU requested core utilization (load 1m)
| Property | Pattern | Type | Deprecated | Definition | Title/Description |
|---|---|---|---|---|---|
| + node | No | object | No | In embedfs://job-metric-data.schema.json | 😅 ERROR in schema generation, a referenced schema could not be loaded, no documentation here unfortunately 🏜️ |
7.1. Property Job metric data list > cpu_load > node
| Type | object |
| Required | Yes |
| Additional properties | Any type allowed |
| Defined in | embedfs://job-metric-data.schema.json |
Description: 😅 ERROR in schema generation, a referenced schema could not be loaded, no documentation here unfortunately 🏜️
8. Property Job metric data list > flops_dp
| Type | object |
| Required | No |
| Additional properties | Any type allowed |
Description: Double precision flop rate
| Property | Pattern | Type | Deprecated | Definition | Title/Description |
|---|---|---|---|---|---|
| - node | No | object | No | In embedfs://job-metric-data.schema.json | 😅 ERROR in schema generation, a referenced schema could not be loaded, no documentation here unfortunately 🏜️ |
| - socket | No | object | No | In embedfs://job-metric-data.schema.json | 😅 ERROR in schema generation, a referenced schema could not be loaded, no documentation here unfortunately 🏜️ |
| - memoryDomain | No | object | No | In embedfs://job-metric-data.schema.json | 😅 ERROR in schema generation, a referenced schema could not be loaded, no documentation here unfortunately 🏜️ |
| - core | No | object | No | In embedfs://job-metric-data.schema.json | 😅 ERROR in schema generation, a referenced schema could not be loaded, no documentation here unfortunately 🏜️ |
| - hwthread | No | object | No | In embedfs://job-metric-data.schema.json | 😅 ERROR in schema generation, a referenced schema could not be loaded, no documentation here unfortunately 🏜️ |
8.1. Property Job metric data list > flops_dp > node
| Type | object |
| Required | No |
| Additional properties | Any type allowed |
| Defined in | embedfs://job-metric-data.schema.json |
Description: 😅 ERROR in schema generation, a referenced schema could not be loaded, no documentation here unfortunately 🏜️
8.2. Property Job metric data list > flops_dp > socket
| Type | object |
| Required | No |
| Additional properties | Any type allowed |
| Defined in | embedfs://job-metric-data.schema.json |
Description: 😅 ERROR in schema generation, a referenced schema could not be loaded, no documentation here unfortunately 🏜️
8.3. Property Job metric data list > flops_dp > memoryDomain
| Type | object |
| Required | No |
| Additional properties | Any type allowed |
| Defined in | embedfs://job-metric-data.schema.json |
Description: 😅 ERROR in schema generation, a referenced schema could not be loaded, no documentation here unfortunately 🏜️
8.4. Property Job metric data list > flops_dp > core
| Type | object |
| Required | No |
| Additional properties | Any type allowed |
| Defined in | embedfs://job-metric-data.schema.json |
Description: 😅 ERROR in schema generation, a referenced schema could not be loaded, no documentation here unfortunately 🏜️
8.5. Property Job metric data list > flops_dp > hwthread
| Type | object |
| Required | No |
| Additional properties | Any type allowed |
| Defined in | embedfs://job-metric-data.schema.json |
Description: 😅 ERROR in schema generation, a referenced schema could not be loaded, no documentation here unfortunately 🏜️
9. Property Job metric data list > flops_sp
| Type | object |
| Required | No |
| Additional properties | Any type allowed |
Description: Single precision flops rate
| Property | Pattern | Type | Deprecated | Definition | Title/Description |
|---|---|---|---|---|---|
| - node | No | object | No | In embedfs://job-metric-data.schema.json | 😅 ERROR in schema generation, a referenced schema could not be loaded, no documentation here unfortunately 🏜️ |
| - socket | No | object | No | In embedfs://job-metric-data.schema.json | 😅 ERROR in schema generation, a referenced schema could not be loaded, no documentation here unfortunately 🏜️ |
| - memoryDomain | No | object | No | In embedfs://job-metric-data.schema.json | 😅 ERROR in schema generation, a referenced schema could not be loaded, no documentation here unfortunately 🏜️ |
| - core | No | object | No | In embedfs://job-metric-data.schema.json | 😅 ERROR in schema generation, a referenced schema could not be loaded, no documentation here unfortunately 🏜️ |
| - hwthread | No | object | No | In embedfs://job-metric-data.schema.json | 😅 ERROR in schema generation, a referenced schema could not be loaded, no documentation here unfortunately 🏜️ |
9.1. Property Job metric data list > flops_sp > node
| Type | object |
| Required | No |
| Additional properties | Any type allowed |
| Defined in | embedfs://job-metric-data.schema.json |
Description: 😅 ERROR in schema generation, a referenced schema could not be loaded, no documentation here unfortunately 🏜️
9.2. Property Job metric data list > flops_sp > socket
| Type | object |
| Required | No |
| Additional properties | Any type allowed |
| Defined in | embedfs://job-metric-data.schema.json |
Description: 😅 ERROR in schema generation, a referenced schema could not be loaded, no documentation here unfortunately 🏜️
9.3. Property Job metric data list > flops_sp > memoryDomain
| Type | object |
| Required | No |
| Additional properties | Any type allowed |
| Defined in | embedfs://job-metric-data.schema.json |
Description: 😅 ERROR in schema generation, a referenced schema could not be loaded, no documentation here unfortunately 🏜️
9.4. Property Job metric data list > flops_sp > core
| Type | object |
| Required | No |
| Additional properties | Any type allowed |
| Defined in | embedfs://job-metric-data.schema.json |
Description: 😅 ERROR in schema generation, a referenced schema could not be loaded, no documentation here unfortunately 🏜️
9.5. Property Job metric data list > flops_sp > hwthread
| Type | object |
| Required | No |
| Additional properties | Any type allowed |
| Defined in | embedfs://job-metric-data.schema.json |
Description: 😅 ERROR in schema generation, a referenced schema could not be loaded, no documentation here unfortunately 🏜️
10. Property Job metric data list > vectorization_ratio
| Type | object |
| Required | No |
| Additional properties | Any type allowed |
Description: Fraction of arithmetic instructions using SIMD instructions
| Property | Pattern | Type | Deprecated | Definition | Title/Description |
|---|---|---|---|---|---|
| - node | No | object | No | In embedfs://job-metric-data.schema.json | 😅 ERROR in schema generation, a referenced schema could not be loaded, no documentation here unfortunately 🏜️ |
| - socket | No | object | No | In embedfs://job-metric-data.schema.json | 😅 ERROR in schema generation, a referenced schema could not be loaded, no documentation here unfortunately 🏜️ |
| - memoryDomain | No | object | No | In embedfs://job-metric-data.schema.json | 😅 ERROR in schema generation, a referenced schema could not be loaded, no documentation here unfortunately 🏜️ |
| - core | No | object | No | In embedfs://job-metric-data.schema.json | 😅 ERROR in schema generation, a referenced schema could not be loaded, no documentation here unfortunately 🏜️ |
| - hwthread | No | object | No | In embedfs://job-metric-data.schema.json | 😅 ERROR in schema generation, a referenced schema could not be loaded, no documentation here unfortunately 🏜️ |
10.1. Property Job metric data list > vectorization_ratio > node
| Type | object |
| Required | No |
| Additional properties | Any type allowed |
| Defined in | embedfs://job-metric-data.schema.json |
Description: 😅 ERROR in schema generation, a referenced schema could not be loaded, no documentation here unfortunately 🏜️
10.2. Property Job metric data list > vectorization_ratio > socket
| Type | object |
| Required | No |
| Additional properties | Any type allowed |
| Defined in | embedfs://job-metric-data.schema.json |
Description: 😅 ERROR in schema generation, a referenced schema could not be loaded, no documentation here unfortunately 🏜️
10.3. Property Job metric data list > vectorization_ratio > memoryDomain
| Type | object |
| Required | No |
| Additional properties | Any type allowed |
| Defined in | embedfs://job-metric-data.schema.json |
Description: 😅 ERROR in schema generation, a referenced schema could not be loaded, no documentation here unfortunately 🏜️
10.4. Property Job metric data list > vectorization_ratio > core
| Type | object |
| Required | No |
| Additional properties | Any type allowed |
| Defined in | embedfs://job-metric-data.schema.json |
Description: 😅 ERROR in schema generation, a referenced schema could not be loaded, no documentation here unfortunately 🏜️
10.5. Property Job metric data list > vectorization_ratio > hwthread
| Type | object |
| Required | No |
| Additional properties | Any type allowed |
| Defined in | embedfs://job-metric-data.schema.json |
Description: 😅 ERROR in schema generation, a referenced schema could not be loaded, no documentation here unfortunately 🏜️
11. Property Job metric data list > cpu_power
| Type | object |
| Required | No |
| Additional properties | Any type allowed |
Description: CPU power consumption
| Property | Pattern | Type | Deprecated | Definition | Title/Description |
|---|---|---|---|---|---|
| - node | No | object | No | In embedfs://job-metric-data.schema.json | 😅 ERROR in schema generation, a referenced schema could not be loaded, no documentation here unfortunately 🏜️ |
| - socket | No | object | No | In embedfs://job-metric-data.schema.json | 😅 ERROR in schema generation, a referenced schema could not be loaded, no documentation here unfortunately 🏜️ |
11.1. Property Job metric data list > cpu_power > node
| Type | object |
| Required | No |
| Additional properties | Any type allowed |
| Defined in | embedfs://job-metric-data.schema.json |
Description: 😅 ERROR in schema generation, a referenced schema could not be loaded, no documentation here unfortunately 🏜️
11.2. Property Job metric data list > cpu_power > socket
| Type | object |
| Required | No |
| Additional properties | Any type allowed |
| Defined in | embedfs://job-metric-data.schema.json |
Description: 😅 ERROR in schema generation, a referenced schema could not be loaded, no documentation here unfortunately 🏜️
12. Property Job metric data list > mem_power
| Type | object |
| Required | No |
| Additional properties | Any type allowed |
Description: Memory power consumption
| Property | Pattern | Type | Deprecated | Definition | Title/Description |
|---|---|---|---|---|---|
| - node | No | object | No | In embedfs://job-metric-data.schema.json | 😅 ERROR in schema generation, a referenced schema could not be loaded, no documentation here unfortunately 🏜️ |
| - socket | No | object | No | In embedfs://job-metric-data.schema.json | 😅 ERROR in schema generation, a referenced schema could not be loaded, no documentation here unfortunately 🏜️ |
12.1. Property Job metric data list > mem_power > node
| Type | object |
| Required | No |
| Additional properties | Any type allowed |
| Defined in | embedfs://job-metric-data.schema.json |
Description: 😅 ERROR in schema generation, a referenced schema could not be loaded, no documentation here unfortunately 🏜️
12.2. Property Job metric data list > mem_power > socket
| Type | object |
| Required | No |
| Additional properties | Any type allowed |
| Defined in | embedfs://job-metric-data.schema.json |
Description: 😅 ERROR in schema generation, a referenced schema could not be loaded, no documentation here unfortunately 🏜️
13. Property Job metric data list > acc_utilization
| Type | object |
| Required | No |
| Additional properties | Any type allowed |
Description: GPU utilization
| Property | Pattern | Type | Deprecated | Definition | Title/Description |
|---|---|---|---|---|---|
| + accelerator | No | object | No | In embedfs://job-metric-data.schema.json | 😅 ERROR in schema generation, a referenced schema could not be loaded, no documentation here unfortunately 🏜️ |
13.1. Property Job metric data list > acc_utilization > accelerator
| Type | object |
| Required | Yes |
| Additional properties | Any type allowed |
| Defined in | embedfs://job-metric-data.schema.json |
Description: 😅 ERROR in schema generation, a referenced schema could not be loaded, no documentation here unfortunately 🏜️
14. Property Job metric data list > acc_mem_used
| Type | object |
| Required | No |
| Additional properties | Any type allowed |
Description: GPU memory capacity used
| Property | Pattern | Type | Deprecated | Definition | Title/Description |
|---|---|---|---|---|---|
| + accelerator | No | object | No | In embedfs://job-metric-data.schema.json | 😅 ERROR in schema generation, a referenced schema could not be loaded, no documentation here unfortunately 🏜️ |
14.1. Property Job metric data list > acc_mem_used > accelerator
| Type | object |
| Required | Yes |
| Additional properties | Any type allowed |
| Defined in | embedfs://job-metric-data.schema.json |
Description: 😅 ERROR in schema generation, a referenced schema could not be loaded, no documentation here unfortunately 🏜️
15. Property Job metric data list > acc_power
| Type | object |
| Required | No |
| Additional properties | Any type allowed |
Description: GPU power consumption
| Property | Pattern | Type | Deprecated | Definition | Title/Description |
|---|---|---|---|---|---|
| + accelerator | No | object | No | In embedfs://job-metric-data.schema.json | 😅 ERROR in schema generation, a referenced schema could not be loaded, no documentation here unfortunately 🏜️ |
15.1. Property Job metric data list > acc_power > accelerator
| Type | object |
| Required | Yes |
| Additional properties | Any type allowed |
| Defined in | embedfs://job-metric-data.schema.json |
Description: 😅 ERROR in schema generation, a referenced schema could not be loaded, no documentation here unfortunately 🏜️
16. Property Job metric data list > clock
| Type | object |
| Required | No |
| Additional properties | Any type allowed |
Description: Average core frequency
| Property | Pattern | Type | Deprecated | Definition | Title/Description |
|---|---|---|---|---|---|
| - node | No | object | No | In embedfs://job-metric-data.schema.json | 😅 ERROR in schema generation, a referenced schema could not be loaded, no documentation here unfortunately 🏜️ |
| - socket | No | object | No | In embedfs://job-metric-data.schema.json | 😅 ERROR in schema generation, a referenced schema could not be loaded, no documentation here unfortunately 🏜️ |
| - memoryDomain | No | object | No | In embedfs://job-metric-data.schema.json | 😅 ERROR in schema generation, a referenced schema could not be loaded, no documentation here unfortunately 🏜️ |
| - core | No | object | No | In embedfs://job-metric-data.schema.json | 😅 ERROR in schema generation, a referenced schema could not be loaded, no documentation here unfortunately 🏜️ |
| - hwthread | No | object | No | In embedfs://job-metric-data.schema.json | 😅 ERROR in schema generation, a referenced schema could not be loaded, no documentation here unfortunately 🏜️ |
16.1. Property Job metric data list > clock > node
| Type | object |
| Required | No |
| Additional properties | Any type allowed |
| Defined in | embedfs://job-metric-data.schema.json |
Description: 😅 ERROR in schema generation, a referenced schema could not be loaded, no documentation here unfortunately 🏜️
16.2. Property Job metric data list > clock > socket
| Type | object |
| Required | No |
| Additional properties | Any type allowed |
| Defined in | embedfs://job-metric-data.schema.json |
Description: 😅 ERROR in schema generation, a referenced schema could not be loaded, no documentation here unfortunately 🏜️
16.3. Property Job metric data list > clock > memoryDomain
| Type | object |
| Required | No |
| Additional properties | Any type allowed |
| Defined in | embedfs://job-metric-data.schema.json |
Description: 😅 ERROR in schema generation, a referenced schema could not be loaded, no documentation here unfortunately 🏜️
16.4. Property Job metric data list > clock > core
| Type | object |
| Required | No |
| Additional properties | Any type allowed |
| Defined in | embedfs://job-metric-data.schema.json |
Description: 😅 ERROR in schema generation, a referenced schema could not be loaded, no documentation here unfortunately 🏜️
16.5. Property Job metric data list > clock > hwthread
| Type | object |
| Required | No |
| Additional properties | Any type allowed |
| Defined in | embedfs://job-metric-data.schema.json |
Description: 😅 ERROR in schema generation, a referenced schema could not be loaded, no documentation here unfortunately 🏜️
17. Property Job metric data list > eth_read_bw
| Type | object |
| Required | No |
| Additional properties | Any type allowed |
Description: Ethernet read bandwidth
| Property | Pattern | Type | Deprecated | Definition | Title/Description |
|---|---|---|---|---|---|
| + node | No | object | No | In embedfs://job-metric-data.schema.json | 😅 ERROR in schema generation, a referenced schema could not be loaded, no documentation here unfortunately 🏜️ |
17.1. Property Job metric data list > eth_read_bw > node
| Type | object |
| Required | Yes |
| Additional properties | Any type allowed |
| Defined in | embedfs://job-metric-data.schema.json |
Description: 😅 ERROR in schema generation, a referenced schema could not be loaded, no documentation here unfortunately 🏜️
18. Property Job metric data list > eth_write_bw
| Type | object |
| Required | No |
| Additional properties | Any type allowed |
Description: Ethernet write bandwidth
| Property | Pattern | Type | Deprecated | Definition | Title/Description |
|---|---|---|---|---|---|
| + node | No | object | No | In embedfs://job-metric-data.schema.json | 😅 ERROR in schema generation, a referenced schema could not be loaded, no documentation here unfortunately 🏜️ |
18.1. Property Job metric data list > eth_write_bw > node
| Type | object |
| Required | Yes |
| Additional properties | Any type allowed |
| Defined in | embedfs://job-metric-data.schema.json |
Description: 😅 ERROR in schema generation, a referenced schema could not be loaded, no documentation here unfortunately 🏜️
19. Property Job metric data list > filesystems
| Type | array of object |
| Required | Yes |
Description: Array of filesystems
| Array restrictions | |
|---|---|
| Min items | 1 |
| Max items | N/A |
| Items unicity | False |
| Additional items | False |
| Tuple validation | See below |
| Each item of this array must be | Description |
|---|---|
| filesystems items | - |
19.1. Job metric data list > filesystems > filesystems items
| Type | object |
| Required | No |
| Additional properties | Any type allowed |
| Property | Pattern | Type | Deprecated | Definition | Title/Description |
|---|---|---|---|---|---|
| + name | No | string | No | - | - |
| + type | No | enum (of string) | No | - | - |
| + read_bw | No | object | No | - | File system read bandwidth |
| + write_bw | No | object | No | - | File system write bandwidth |
| - read_req | No | object | No | - | File system read requests |
| - write_req | No | object | No | - | File system write requests |
| - inodes | No | object | No | - | File system write requests |
| - accesses | No | object | No | - | File system open and close |
| - fsync | No | object | No | - | File system fsync |
| - create | No | object | No | - | File system create |
| - open | No | object | No | - | File system open |
| - close | No | object | No | - | File system close |
| - seek | No | object | No | - | File system seek |
19.1.1. Property Job metric data list > filesystems > filesystems items > name
| Type | string |
| Required | Yes |
19.1.2. Property Job metric data list > filesystems > filesystems items > type
| Type | enum (of string) |
| Required | Yes |
Must be one of:
- “nfs”
- “lustre”
- “gpfs”
- “nvme”
- “ssd”
- “hdd”
- “beegfs”
19.1.3. Property Job metric data list > filesystems > filesystems items > read_bw
| Type | object |
| Required | Yes |
| Additional properties | Any type allowed |
Description: File system read bandwidth
| Property | Pattern | Type | Deprecated | Definition | Title/Description |
|---|---|---|---|---|---|
| + node | No | object | No | In embedfs://job-metric-data.schema.json | 😅 ERROR in schema generation, a referenced schema could not be loaded, no documentation here unfortunately 🏜️ |
19.1.3.1. Property Job metric data list > filesystems > filesystems items > read_bw > node
| Type | object |
| Required | Yes |
| Additional properties | Any type allowed |
| Defined in | embedfs://job-metric-data.schema.json |
Description: 😅 ERROR in schema generation, a referenced schema could not be loaded, no documentation here unfortunately 🏜️
19.1.4. Property Job metric data list > filesystems > filesystems items > write_bw
| Type | object |
| Required | Yes |
| Additional properties | Any type allowed |
Description: File system write bandwidth
| Property | Pattern | Type | Deprecated | Definition | Title/Description |
|---|---|---|---|---|---|
| + node | No | object | No | In embedfs://job-metric-data.schema.json | 😅 ERROR in schema generation, a referenced schema could not be loaded, no documentation here unfortunately 🏜️ |
19.1.4.1. Property Job metric data list > filesystems > filesystems items > write_bw > node
| Type | object |
| Required | Yes |
| Additional properties | Any type allowed |
| Defined in | embedfs://job-metric-data.schema.json |
Description: 😅 ERROR in schema generation, a referenced schema could not be loaded, no documentation here unfortunately 🏜️
19.1.5. Property Job metric data list > filesystems > filesystems items > read_req
| Type | object |
| Required | No |
| Additional properties | Any type allowed |
Description: File system read requests
| Property | Pattern | Type | Deprecated | Definition | Title/Description |
|---|---|---|---|---|---|
| + node | No | object | No | In embedfs://job-metric-data.schema.json | 😅 ERROR in schema generation, a referenced schema could not be loaded, no documentation here unfortunately 🏜️ |
19.1.5.1. Property Job metric data list > filesystems > filesystems items > read_req > node
| Type | object |
| Required | Yes |
| Additional properties | Any type allowed |
| Defined in | embedfs://job-metric-data.schema.json |
Description: 😅 ERROR in schema generation, a referenced schema could not be loaded, no documentation here unfortunately 🏜️
19.1.6. Property Job metric data list > filesystems > filesystems items > write_req
| Type | object |
| Required | No |
| Additional properties | Any type allowed |
Description: File system write requests
| Property | Pattern | Type | Deprecated | Definition | Title/Description |
|---|---|---|---|---|---|
| + node | No | object | No | In embedfs://job-metric-data.schema.json | 😅 ERROR in schema generation, a referenced schema could not be loaded, no documentation here unfortunately 🏜️ |
19.1.6.1. Property Job metric data list > filesystems > filesystems items > write_req > node
| Type | object |
| Required | Yes |
| Additional properties | Any type allowed |
| Defined in | embedfs://job-metric-data.schema.json |
Description: 😅 ERROR in schema generation, a referenced schema could not be loaded, no documentation here unfortunately 🏜️
19.1.7. Property Job metric data list > filesystems > filesystems items > inodes
| Type | object |
| Required | No |
| Additional properties | Any type allowed |
Description: File system write requests
| Property | Pattern | Type | Deprecated | Definition | Title/Description |
|---|---|---|---|---|---|
| + node | No | object | No | In embedfs://job-metric-data.schema.json | 😅 ERROR in schema generation, a referenced schema could not be loaded, no documentation here unfortunately 🏜️ |
19.1.7.1. Property Job metric data list > filesystems > filesystems items > inodes > node
| Type | object |
| Required | Yes |
| Additional properties | Any type allowed |
| Defined in | embedfs://job-metric-data.schema.json |
Description: 😅 ERROR in schema generation, a referenced schema could not be loaded, no documentation here unfortunately 🏜️
19.1.8. Property Job metric data list > filesystems > filesystems items > accesses
| Type | object |
| Required | No |
| Additional properties | Any type allowed |
Description: File system open and close
| Property | Pattern | Type | Deprecated | Definition | Title/Description |
|---|---|---|---|---|---|
| + node | No | object | No | In embedfs://job-metric-data.schema.json | 😅 ERROR in schema generation, a referenced schema could not be loaded, no documentation here unfortunately 🏜️ |
19.1.8.1. Property Job metric data list > filesystems > filesystems items > accesses > node
| Type | object |
| Required | Yes |
| Additional properties | Any type allowed |
| Defined in | embedfs://job-metric-data.schema.json |
Description: 😅 ERROR in schema generation, a referenced schema could not be loaded, no documentation here unfortunately 🏜️
19.1.9. Property Job metric data list > filesystems > filesystems items > fsync
| Type | object |
| Required | No |
| Additional properties | Any type allowed |
Description: File system fsync
| Property | Pattern | Type | Deprecated | Definition | Title/Description |
|---|---|---|---|---|---|
| + node | No | object | No | In embedfs://job-metric-data.schema.json | 😅 ERROR in schema generation, a referenced schema could not be loaded, no documentation here unfortunately 🏜️ |
19.1.9.1. Property Job metric data list > filesystems > filesystems items > fsync > node
| Type | object |
| Required | Yes |
| Additional properties | Any type allowed |
| Defined in | embedfs://job-metric-data.schema.json |
Description: 😅 ERROR in schema generation, a referenced schema could not be loaded, no documentation here unfortunately 🏜️
19.1.10. Property Job metric data list > filesystems > filesystems items > create
| Type | object |
| Required | No |
| Additional properties | Any type allowed |
Description: File system create
| Property | Pattern | Type | Deprecated | Definition | Title/Description |
|---|---|---|---|---|---|
| + node | No | object | No | In embedfs://job-metric-data.schema.json | 😅 ERROR in schema generation, a referenced schema could not be loaded, no documentation here unfortunately 🏜️ |
19.1.10.1. Property Job metric data list > filesystems > filesystems items > create > node
| Type | object |
| Required | Yes |
| Additional properties | Any type allowed |
| Defined in | embedfs://job-metric-data.schema.json |
Description: 😅 ERROR in schema generation, a referenced schema could not be loaded, no documentation here unfortunately 🏜️
19.1.11. Property Job metric data list > filesystems > filesystems items > open
| Type | object |
| Required | No |
| Additional properties | Any type allowed |
Description: File system open
| Property | Pattern | Type | Deprecated | Definition | Title/Description |
|---|---|---|---|---|---|
| + node | No | object | No | In embedfs://job-metric-data.schema.json | 😅 ERROR in schema generation, a referenced schema could not be loaded, no documentation here unfortunately 🏜️ |
19.1.11.1. Property Job metric data list > filesystems > filesystems items > open > node
| Type | object |
| Required | Yes |
| Additional properties | Any type allowed |
| Defined in | embedfs://job-metric-data.schema.json |
Description: 😅 ERROR in schema generation, a referenced schema could not be loaded, no documentation here unfortunately 🏜️
19.1.12. Property Job metric data list > filesystems > filesystems items > close
| Type | object |
| Required | No |
| Additional properties | Any type allowed |
Description: File system close
| Property | Pattern | Type | Deprecated | Definition | Title/Description |
|---|---|---|---|---|---|
| + node | No | object | No | In embedfs://job-metric-data.schema.json | 😅 ERROR in schema generation, a referenced schema could not be loaded, no documentation here unfortunately 🏜️ |
19.1.12.1. Property Job metric data list > filesystems > filesystems items > close > node
| Type | object |
| Required | Yes |
| Additional properties | Any type allowed |
| Defined in | embedfs://job-metric-data.schema.json |
Description: 😅 ERROR in schema generation, a referenced schema could not be loaded, no documentation here unfortunately 🏜️
19.1.13. Property Job metric data list > filesystems > filesystems items > seek
| Type | object |
| Required | No |
| Additional properties | Any type allowed |
Description: File system seek
| Property | Pattern | Type | Deprecated | Definition | Title/Description |
|---|---|---|---|---|---|
| + node | No | object | No | In embedfs://job-metric-data.schema.json | 😅 ERROR in schema generation, a referenced schema could not be loaded, no documentation here unfortunately 🏜️ |
19.1.13.1. Property Job metric data list > filesystems > filesystems items > seek > node
| Type | object |
| Required | Yes |
| Additional properties | Any type allowed |
| Defined in | embedfs://job-metric-data.schema.json |
Description: 😅 ERROR in schema generation, a referenced schema could not be loaded, no documentation here unfortunately 🏜️
Generated using json-schema-for-humans on 2024-12-04 at 16:45:59 +0100
7.1.7.4 - Job Statistics Schema
The following schema in its raw form can be found in the ClusterCockpit GitHub repository.
Manual Updates
Changes to the original JSON schema found in the repository are not automatically rendered in this reference documentation.Last Update: 04.12.2024Job statistics
- 1. Property
Job statistics > unit - 2. Property
Job statistics > avg - 3. Property
Job statistics > min - 4. Property
Job statistics > max
Title: Job statistics
| Type | object |
| Required | No |
| Additional properties | Any type allowed |
Description: Format specification for job metric statistics
| Property | Pattern | Type | Deprecated | Definition | Title/Description |
|---|---|---|---|---|---|
| + unit | No | object | No | In embedfs://unit.schema.json | Metric unit |
| + avg | No | number | No | - | Job metric average |
| + min | No | number | No | - | Job metric minimum |
| + max | No | number | No | - | Job metric maximum |
1. Property Job statistics > unit
| Type | object |
| Required | Yes |
| Additional properties | Any type allowed |
| Defined in | embedfs://unit.schema.json |
Description: Metric unit
2. Property Job statistics > avg
| Type | number |
| Required | Yes |
Description: Job metric average
| Restrictions | |
|---|---|
| Minimum | ≥ 0 |
3. Property Job statistics > min
| Type | number |
| Required | Yes |
Description: Job metric minimum
| Restrictions | |
|---|---|
| Minimum | ≥ 0 |
4. Property Job statistics > max
| Type | number |
| Required | Yes |
Description: Job metric maximum
| Restrictions | |
|---|---|
| Minimum | ≥ 0 |
Generated using json-schema-for-humans on 2024-12-04 at 16:45:59 +0100
7.1.7.5 - Unit Schema
The following schema in its raw form can be found in the ClusterCockpit GitHub repository.
Manual Updates
Changes to the original JSON schema found in the repository are not automatically rendered in this reference documentation.Last Update: 04.12.2024Metric unit
Title: Metric unit
| Type | object |
| Required | No |
| Additional properties | Any type allowed |
Description: Format specification for job metric units
| Property | Pattern | Type | Deprecated | Definition | Title/Description |
|---|---|---|---|---|---|
| + base | No | enum (of string) | No | - | Metric base unit |
| - prefix | No | enum (of string) | No | - | Unit prefix |
1. Property Metric unit > base
| Type | enum (of string) |
| Required | Yes |
Description: Metric base unit
Must be one of:
- “B”
- “F”
- “B/s”
- “F/s”
- “CPI”
- “IPC”
- “Hz”
- “W”
- “°C”
- ""
2. Property Metric unit > prefix
| Type | enum (of string) |
| Required | No |
Description: Unit prefix
Must be one of:
- “K”
- “M”
- “G”
- “T”
- “P”
- “E”
Generated using json-schema-for-humans on 2024-12-04 at 16:45:59 +0100
7.1.7.6 - Job Archive Metadata Schema
The following schema in its raw form can be found in the ClusterCockpit GitHub repository.
Manual Updates
Changes to the original JSON schema found in the repository are not automatically rendered in this reference documentation.Last Update: 04.12.2024Job meta data
- 1. Property
Job meta data > jobId - 2. Property
Job meta data > user - 3. Property
Job meta data > project - 4. Property
Job meta data > cluster - 5. Property
Job meta data > subCluster - 6. Property
Job meta data > partition - 7. Property
Job meta data > arrayJobId - 8. Property
Job meta data > numNodes - 9. Property
Job meta data > numHwthreads - 10. Property
Job meta data > numAcc - 11. Property
Job meta data > exclusive - 12. Property
Job meta data > monitoringStatus - 13. Property
Job meta data > smt - 14. Property
Job meta data > walltime - 15. Property
Job meta data > jobState - 16. Property
Job meta data > startTime - 17. Property
Job meta data > duration - 18. Property
Job meta data > resources- 18.1. Job meta data > resources > resources items
- 19. Property
Job meta data > metaData - 20. Property
Job meta data > tags - 21. Property
Job meta data > statistics- 21.1. Property
Job meta data > statistics > mem_used - 21.2. Property
Job meta data > statistics > cpu_load - 21.3. Property
Job meta data > statistics > flops_any - 21.4. Property
Job meta data > statistics > mem_bw - 21.5. Property
Job meta data > statistics > net_bw - 21.6. Property
Job meta data > statistics > file_bw - 21.7. Property
Job meta data > statistics > ipc - 21.8. Property
Job meta data > statistics > cpu_user - 21.9. Property
Job meta data > statistics > flops_dp - 21.10. Property
Job meta data > statistics > flops_sp - 21.11. Property
Job meta data > statistics > rapl_power - 21.12. Property
Job meta data > statistics > acc_used - 21.13. Property
Job meta data > statistics > acc_mem_used - 21.14. Property
Job meta data > statistics > acc_power - 21.15. Property
Job meta data > statistics > clock - 21.16. Property
Job meta data > statistics > eth_read_bw - 21.17. Property
Job meta data > statistics > eth_write_bw - 21.18. Property
Job meta data > statistics > ic_rcv_packets - 21.19. Property
Job meta data > statistics > ic_send_packets - 21.20. Property
Job meta data > statistics > ic_read_bw - 21.21. Property
Job meta data > statistics > ic_write_bw - 21.22. Property
Job meta data > statistics > filesystems- 21.22.1. Job meta data > statistics > filesystems > filesystems items
- 21.22.1.1. Property
Job meta data > statistics > filesystems > filesystems items > name - 21.22.1.2. Property
Job meta data > statistics > filesystems > filesystems items > type - 21.22.1.3. Property
Job meta data > statistics > filesystems > filesystems items > read_bw - 21.22.1.4. Property
Job meta data > statistics > filesystems > filesystems items > write_bw - 21.22.1.5. Property
Job meta data > statistics > filesystems > filesystems items > read_req - 21.22.1.6. Property
Job meta data > statistics > filesystems > filesystems items > write_req - 21.22.1.7. Property
Job meta data > statistics > filesystems > filesystems items > inodes - 21.22.1.8. Property
Job meta data > statistics > filesystems > filesystems items > accesses - 21.22.1.9. Property
Job meta data > statistics > filesystems > filesystems items > fsync - 21.22.1.10. Property
Job meta data > statistics > filesystems > filesystems items > create - 21.22.1.11. Property
Job meta data > statistics > filesystems > filesystems items > open - 21.22.1.12. Property
Job meta data > statistics > filesystems > filesystems items > close - 21.22.1.13. Property
Job meta data > statistics > filesystems > filesystems items > seek
- 21.22.1.1. Property
- 21.22.1. Job meta data > statistics > filesystems > filesystems items
- 21.1. Property
Title: Job meta data
| Type | object |
| Required | No |
| Additional properties | Any type allowed |
Description: Meta data information of a HPC job
| Property | Pattern | Type | Deprecated | Definition | Title/Description |
|---|---|---|---|---|---|
| + jobId | No | integer | No | - | The unique identifier of a job |
| + user | No | string | No | - | The unique identifier of a user |
| + project | No | string | No | - | The unique identifier of a project |
| + cluster | No | string | No | - | The unique identifier of a cluster |
| + subCluster | No | string | No | - | The unique identifier of a sub cluster |
| - partition | No | string | No | - | The Slurm partition to which the job was submitted |
| - arrayJobId | No | integer | No | - | The unique identifier of an array job |
| + numNodes | No | integer | No | - | Number of nodes used |
| - numHwthreads | No | integer | No | - | Number of HWThreads used |
| - numAcc | No | integer | No | - | Number of accelerators used |
| + exclusive | No | integer | No | - | Specifies how nodes are shared. 0 - Shared among multiple jobs of multiple users, 1 - Job exclusive, 2 - Shared among multiple jobs of same user |
| - monitoringStatus | No | integer | No | - | State of monitoring system during job run |
| - smt | No | integer | No | - | SMT threads used by job |
| - walltime | No | integer | No | - | Requested walltime of job in seconds |
| + jobState | No | enum (of string) | No | - | Final state of job |
| + startTime | No | integer | No | - | Start epoch time stamp in seconds |
| + duration | No | integer | No | - | Duration of job in seconds |
| + resources | No | array of object | No | - | Resources used by job |
| - metaData | No | object | No | - | Additional information about the job |
| - tags | No | array of object | No | - | List of tags |
| + statistics | No | object | No | - | Job statistic data |
1. Property Job meta data > jobId
| Type | integer |
| Required | Yes |
Description: The unique identifier of a job
2. Property Job meta data > user
| Type | string |
| Required | Yes |
Description: The unique identifier of a user
3. Property Job meta data > project
| Type | string |
| Required | Yes |
Description: The unique identifier of a project
4. Property Job meta data > cluster
| Type | string |
| Required | Yes |
Description: The unique identifier of a cluster
5. Property Job meta data > subCluster
| Type | string |
| Required | Yes |
Description: The unique identifier of a sub cluster
6. Property Job meta data > partition
| Type | string |
| Required | No |
Description: The Slurm partition to which the job was submitted
7. Property Job meta data > arrayJobId
| Type | integer |
| Required | No |
Description: The unique identifier of an array job
8. Property Job meta data > numNodes
| Type | integer |
| Required | Yes |
Description: Number of nodes used
| Restrictions | |
|---|---|
| Minimum | > 0 |
9. Property Job meta data > numHwthreads
| Type | integer |
| Required | No |
Description: Number of HWThreads used
| Restrictions | |
|---|---|
| Minimum | > 0 |
10. Property Job meta data > numAcc
| Type | integer |
| Required | No |
Description: Number of accelerators used
| Restrictions | |
|---|---|
| Minimum | > 0 |
11. Property Job meta data > exclusive
| Type | integer |
| Required | Yes |
Description: Specifies how nodes are shared. 0 - Shared among multiple jobs of multiple users, 1 - Job exclusive, 2 - Shared among multiple jobs of same user
| Restrictions | |
|---|---|
| Minimum | ≥ 0 |
| Maximum | ≤ 2 |
12. Property Job meta data > monitoringStatus
| Type | integer |
| Required | No |
Description: State of monitoring system during job run
13. Property Job meta data > smt
| Type | integer |
| Required | No |
Description: SMT threads used by job
14. Property Job meta data > walltime
| Type | integer |
| Required | No |
Description: Requested walltime of job in seconds
| Restrictions | |
|---|---|
| Minimum | > 0 |
15. Property Job meta data > jobState
| Type | enum (of string) |
| Required | Yes |
Description: Final state of job
Must be one of:
- “completed”
- “failed”
- “cancelled”
- “stopped”
- “out_of_memory”
- “timeout”
16. Property Job meta data > startTime
| Type | integer |
| Required | Yes |
Description: Start epoch time stamp in seconds
| Restrictions | |
|---|---|
| Minimum | > 0 |
17. Property Job meta data > duration
| Type | integer |
| Required | Yes |
Description: Duration of job in seconds
| Restrictions | |
|---|---|
| Minimum | > 0 |
18. Property Job meta data > resources
| Type | array of object |
| Required | Yes |
Description: Resources used by job
| Array restrictions | |
|---|---|
| Min items | N/A |
| Max items | N/A |
| Items unicity | False |
| Additional items | False |
| Tuple validation | See below |
| Each item of this array must be | Description |
|---|---|
| resources items | - |
18.1. Job meta data > resources > resources items
| Type | object |
| Required | No |
| Additional properties | Any type allowed |
| Property | Pattern | Type | Deprecated | Definition | Title/Description |
|---|---|---|---|---|---|
| + hostname | No | string | No | - | - |
| - hwthreads | No | array of integer | No | - | List of OS processor ids |
| - accelerators | No | array of string | No | - | List of of accelerator device ids |
| - configuration | No | string | No | - | The configuration options of the node |
18.1.1. Property Job meta data > resources > resources items > hostname
| Type | string |
| Required | Yes |
18.1.2. Property Job meta data > resources > resources items > hwthreads
| Type | array of integer |
| Required | No |
Description: List of OS processor ids
| Array restrictions | |
|---|---|
| Min items | N/A |
| Max items | N/A |
| Items unicity | False |
| Additional items | False |
| Tuple validation | See below |
| Each item of this array must be | Description |
|---|---|
| hwthreads items | - |
18.1.2.1. Job meta data > resources > resources items > hwthreads > hwthreads items
| Type | integer |
| Required | No |
18.1.3. Property Job meta data > resources > resources items > accelerators
| Type | array of string |
| Required | No |
Description: List of of accelerator device ids
| Array restrictions | |
|---|---|
| Min items | N/A |
| Max items | N/A |
| Items unicity | False |
| Additional items | False |
| Tuple validation | See below |
| Each item of this array must be | Description |
|---|---|
| accelerators items | - |
18.1.3.1. Job meta data > resources > resources items > accelerators > accelerators items
| Type | string |
| Required | No |
18.1.4. Property Job meta data > resources > resources items > configuration
| Type | string |
| Required | No |
Description: The configuration options of the node
19. Property Job meta data > metaData
| Type | object |
| Required | No |
| Additional properties | Any type allowed |
Description: Additional information about the job
| Property | Pattern | Type | Deprecated | Definition | Title/Description |
|---|---|---|---|---|---|
| - jobScript | No | string | No | - | The batch script of the job |
| - jobName | No | string | No | - | Slurm Job name |
| - slurmInfo | No | string | No | - | Additional slurm infos as show by scontrol show job |
19.1. Property Job meta data > metaData > jobScript
| Type | string |
| Required | No |
Description: The batch script of the job
19.2. Property Job meta data > metaData > jobName
| Type | string |
| Required | No |
Description: Slurm Job name
19.3. Property Job meta data > metaData > slurmInfo
| Type | string |
| Required | No |
Description: Additional slurm infos as show by scontrol show job
20. Property Job meta data > tags
| Type | array of object |
| Required | No |
Description: List of tags
| Array restrictions | |
|---|---|
| Min items | N/A |
| Max items | N/A |
| Items unicity | True |
| Additional items | False |
| Tuple validation | See below |
| Each item of this array must be | Description |
|---|---|
| tags items | - |
20.1. Job meta data > tags > tags items
| Type | object |
| Required | No |
| Additional properties | Any type allowed |
| Property | Pattern | Type | Deprecated | Definition | Title/Description |
|---|---|---|---|---|---|
| + name | No | string | No | - | - |
| + type | No | string | No | - | - |
20.1.1. Property Job meta data > tags > tags items > name
| Type | string |
| Required | Yes |
20.1.2. Property Job meta data > tags > tags items > type
| Type | string |
| Required | Yes |
21. Property Job meta data > statistics
| Type | object |
| Required | Yes |
| Additional properties | Any type allowed |
Description: Job statistic data
| Property | Pattern | Type | Deprecated | Definition | Title/Description |
|---|---|---|---|---|---|
| + mem_used | No | object | No | In embedfs://job-metric-statistics.schema.json | Memory capacity used (required) |
| + cpu_load | No | object | No | In embedfs://job-metric-statistics.schema.json | CPU requested core utilization (load 1m) (required) |
| + flops_any | No | object | No | In embedfs://job-metric-statistics.schema.json | Total flop rate with DP flops scaled up (required) |
| + mem_bw | No | object | No | In embedfs://job-metric-statistics.schema.json | Main memory bandwidth (required) |
| - net_bw | No | object | No | In embedfs://job-metric-statistics.schema.json | Total fast interconnect network bandwidth (required) |
| - file_bw | No | object | No | In embedfs://job-metric-statistics.schema.json | Total file IO bandwidth (required) |
| - ipc | No | object | No | In embedfs://job-metric-statistics.schema.json | Instructions executed per cycle |
| + cpu_user | No | object | No | In embedfs://job-metric-statistics.schema.json | CPU user active core utilization |
| - flops_dp | No | object | No | In embedfs://job-metric-statistics.schema.json | Double precision flop rate |
| - flops_sp | No | object | No | In embedfs://job-metric-statistics.schema.json | Single precision flops rate |
| - rapl_power | No | object | No | In embedfs://job-metric-statistics.schema.json | CPU power consumption |
| - acc_used | No | object | No | In embedfs://job-metric-statistics.schema.json | GPU utilization |
| - acc_mem_used | No | object | No | In embedfs://job-metric-statistics.schema.json | GPU memory capacity used |
| - acc_power | No | object | No | In embedfs://job-metric-statistics.schema.json | GPU power consumption |
| - clock | No | object | No | In embedfs://job-metric-statistics.schema.json | Average core frequency |
| - eth_read_bw | No | object | No | In embedfs://job-metric-statistics.schema.json | Ethernet read bandwidth |
| - eth_write_bw | No | object | No | In embedfs://job-metric-statistics.schema.json | Ethernet write bandwidth |
| - ic_rcv_packets | No | object | No | In embedfs://job-metric-statistics.schema.json | Network interconnect read packets |
| - ic_send_packets | No | object | No | In embedfs://job-metric-statistics.schema.json | Network interconnect send packet |
| - ic_read_bw | No | object | No | In embedfs://job-metric-statistics.schema.json | Network interconnect read bandwidth |
| - ic_write_bw | No | object | No | In embedfs://job-metric-statistics.schema.json | Network interconnect write bandwidth |
| - filesystems | No | array of object | No | - | Array of filesystems |
21.1. Property Job meta data > statistics > mem_used
| Type | object |
| Required | Yes |
| Additional properties | Any type allowed |
| Defined in | embedfs://job-metric-statistics.schema.json |
Description: Memory capacity used (required)
21.2. Property Job meta data > statistics > cpu_load
| Type | object |
| Required | Yes |
| Additional properties | Any type allowed |
| Defined in | embedfs://job-metric-statistics.schema.json |
Description: CPU requested core utilization (load 1m) (required)
21.3. Property Job meta data > statistics > flops_any
| Type | object |
| Required | Yes |
| Additional properties | Any type allowed |
| Defined in | embedfs://job-metric-statistics.schema.json |
Description: Total flop rate with DP flops scaled up (required)
21.4. Property Job meta data > statistics > mem_bw
| Type | object |
| Required | Yes |
| Additional properties | Any type allowed |
| Defined in | embedfs://job-metric-statistics.schema.json |
Description: Main memory bandwidth (required)
21.5. Property Job meta data > statistics > net_bw
| Type | object |
| Required | No |
| Additional properties | Any type allowed |
| Defined in | embedfs://job-metric-statistics.schema.json |
Description: Total fast interconnect network bandwidth (required)
21.6. Property Job meta data > statistics > file_bw
| Type | object |
| Required | No |
| Additional properties | Any type allowed |
| Defined in | embedfs://job-metric-statistics.schema.json |
Description: Total file IO bandwidth (required)
21.7. Property Job meta data > statistics > ipc
| Type | object |
| Required | No |
| Additional properties | Any type allowed |
| Defined in | embedfs://job-metric-statistics.schema.json |
Description: Instructions executed per cycle
21.8. Property Job meta data > statistics > cpu_user
| Type | object |
| Required | Yes |
| Additional properties | Any type allowed |
| Defined in | embedfs://job-metric-statistics.schema.json |
Description: CPU user active core utilization
21.9. Property Job meta data > statistics > flops_dp
| Type | object |
| Required | No |
| Additional properties | Any type allowed |
| Defined in | embedfs://job-metric-statistics.schema.json |
Description: Double precision flop rate
21.10. Property Job meta data > statistics > flops_sp
| Type | object |
| Required | No |
| Additional properties | Any type allowed |
| Defined in | embedfs://job-metric-statistics.schema.json |
Description: Single precision flops rate
21.11. Property Job meta data > statistics > rapl_power
| Type | object |
| Required | No |
| Additional properties | Any type allowed |
| Defined in | embedfs://job-metric-statistics.schema.json |
Description: CPU power consumption
21.12. Property Job meta data > statistics > acc_used
| Type | object |
| Required | No |
| Additional properties | Any type allowed |
| Defined in | embedfs://job-metric-statistics.schema.json |
Description: GPU utilization
21.13. Property Job meta data > statistics > acc_mem_used
| Type | object |
| Required | No |
| Additional properties | Any type allowed |
| Defined in | embedfs://job-metric-statistics.schema.json |
Description: GPU memory capacity used
21.14. Property Job meta data > statistics > acc_power
| Type | object |
| Required | No |
| Additional properties | Any type allowed |
| Defined in | embedfs://job-metric-statistics.schema.json |
Description: GPU power consumption
21.15. Property Job meta data > statistics > clock
| Type | object |
| Required | No |
| Additional properties | Any type allowed |
| Defined in | embedfs://job-metric-statistics.schema.json |
Description: Average core frequency
21.16. Property Job meta data > statistics > eth_read_bw
| Type | object |
| Required | No |
| Additional properties | Any type allowed |
| Defined in | embedfs://job-metric-statistics.schema.json |
Description: Ethernet read bandwidth
21.17. Property Job meta data > statistics > eth_write_bw
| Type | object |
| Required | No |
| Additional properties | Any type allowed |
| Defined in | embedfs://job-metric-statistics.schema.json |
Description: Ethernet write bandwidth
21.18. Property Job meta data > statistics > ic_rcv_packets
| Type | object |
| Required | No |
| Additional properties | Any type allowed |
| Defined in | embedfs://job-metric-statistics.schema.json |
Description: Network interconnect read packets
21.19. Property Job meta data > statistics > ic_send_packets
| Type | object |
| Required | No |
| Additional properties | Any type allowed |
| Defined in | embedfs://job-metric-statistics.schema.json |
Description: Network interconnect send packet
21.20. Property Job meta data > statistics > ic_read_bw
| Type | object |
| Required | No |
| Additional properties | Any type allowed |
| Defined in | embedfs://job-metric-statistics.schema.json |
Description: Network interconnect read bandwidth
21.21. Property Job meta data > statistics > ic_write_bw
| Type | object |
| Required | No |
| Additional properties | Any type allowed |
| Defined in | embedfs://job-metric-statistics.schema.json |
Description: Network interconnect write bandwidth
21.22. Property Job meta data > statistics > filesystems
| Type | array of object |
| Required | No |
Description: Array of filesystems
| Array restrictions | |
|---|---|
| Min items | 1 |
| Max items | N/A |
| Items unicity | False |
| Additional items | False |
| Tuple validation | See below |
| Each item of this array must be | Description |
|---|---|
| filesystems items | - |
21.22.1. Job meta data > statistics > filesystems > filesystems items
| Type | object |
| Required | No |
| Additional properties | Any type allowed |
| Property | Pattern | Type | Deprecated | Definition | Title/Description |
|---|---|---|---|---|---|
| + name | No | string | No | - | - |
| + type | No | enum (of string) | No | - | - |
| + read_bw | No | object | No | In embedfs://job-metric-statistics.schema.json | File system read bandwidth |
| + write_bw | No | object | No | In embedfs://job-metric-statistics.schema.json | File system write bandwidth |
| - read_req | No | object | No | In embedfs://job-metric-statistics.schema.json | File system read requests |
| - write_req | No | object | No | In embedfs://job-metric-statistics.schema.json | File system write requests |
| - inodes | No | object | No | In embedfs://job-metric-statistics.schema.json | File system write requests |
| - accesses | No | object | No | In embedfs://job-metric-statistics.schema.json | File system open and close |
| - fsync | No | object | No | In embedfs://job-metric-statistics.schema.json | File system fsync |
| - create | No | object | No | In embedfs://job-metric-statistics.schema.json | File system create |
| - open | No | object | No | In embedfs://job-metric-statistics.schema.json | File system open |
| - close | No | object | No | In embedfs://job-metric-statistics.schema.json | File system close |
| - seek | No | object | No | In embedfs://job-metric-statistics.schema.json | File system seek |
21.22.1.1. Property Job meta data > statistics > filesystems > filesystems items > name
| Type | string |
| Required | Yes |
21.22.1.2. Property Job meta data > statistics > filesystems > filesystems items > type
| Type | enum (of string) |
| Required | Yes |
Must be one of:
- “nfs”
- “lustre”
- “gpfs”
- “nvme”
- “ssd”
- “hdd”
- “beegfs”
21.22.1.3. Property Job meta data > statistics > filesystems > filesystems items > read_bw
| Type | object |
| Required | Yes |
| Additional properties | Any type allowed |
| Defined in | embedfs://job-metric-statistics.schema.json |
Description: File system read bandwidth
21.22.1.4. Property Job meta data > statistics > filesystems > filesystems items > write_bw
| Type | object |
| Required | Yes |
| Additional properties | Any type allowed |
| Defined in | embedfs://job-metric-statistics.schema.json |
Description: File system write bandwidth
21.22.1.5. Property Job meta data > statistics > filesystems > filesystems items > read_req
| Type | object |
| Required | No |
| Additional properties | Any type allowed |
| Defined in | embedfs://job-metric-statistics.schema.json |
Description: File system read requests
21.22.1.6. Property Job meta data > statistics > filesystems > filesystems items > write_req
| Type | object |
| Required | No |
| Additional properties | Any type allowed |
| Defined in | embedfs://job-metric-statistics.schema.json |
Description: File system write requests
21.22.1.7. Property Job meta data > statistics > filesystems > filesystems items > inodes
| Type | object |
| Required | No |
| Additional properties | Any type allowed |
| Defined in | embedfs://job-metric-statistics.schema.json |
Description: File system write requests
21.22.1.8. Property Job meta data > statistics > filesystems > filesystems items > accesses
| Type | object |
| Required | No |
| Additional properties | Any type allowed |
| Defined in | embedfs://job-metric-statistics.schema.json |
Description: File system open and close
21.22.1.9. Property Job meta data > statistics > filesystems > filesystems items > fsync
| Type | object |
| Required | No |
| Additional properties | Any type allowed |
| Defined in | embedfs://job-metric-statistics.schema.json |
Description: File system fsync
21.22.1.10. Property Job meta data > statistics > filesystems > filesystems items > create
| Type | object |
| Required | No |
| Additional properties | Any type allowed |
| Defined in | embedfs://job-metric-statistics.schema.json |
Description: File system create
21.22.1.11. Property Job meta data > statistics > filesystems > filesystems items > open
| Type | object |
| Required | No |
| Additional properties | Any type allowed |
| Defined in | embedfs://job-metric-statistics.schema.json |
Description: File system open
21.22.1.12. Property Job meta data > statistics > filesystems > filesystems items > close
| Type | object |
| Required | No |
| Additional properties | Any type allowed |
| Defined in | embedfs://job-metric-statistics.schema.json |
Description: File system close
21.22.1.13. Property Job meta data > statistics > filesystems > filesystems items > seek
| Type | object |
| Required | No |
| Additional properties | Any type allowed |
| Defined in | embedfs://job-metric-statistics.schema.json |
Description: File system seek
Generated using json-schema-for-humans on 2024-12-04 at 16:45:59 +0100
7.1.7.7 - Job Archive Metrics Data Schema
The following schema in its raw form can be found in the ClusterCockpit GitHub repository.
Manual Updates
Changes to the original JSON schema found in the repository are not automatically rendered in this reference documentation.Last Update: 04.12.2024Job metric data
- 1. Property
Job metric data > unit - 2. Property
Job metric data > timestep - 3. Property
Job metric data > thresholds - 4. Property
Job metric data > statisticsSeries- 4.1. Property
Job metric data > statisticsSeries > min - 4.2. Property
Job metric data > statisticsSeries > max - 4.3. Property
Job metric data > statisticsSeries > mean - 4.4. Property
Job metric data > statisticsSeries > percentiles- 4.4.1. Property
Job metric data > statisticsSeries > percentiles > 10 - 4.4.2. Property
Job metric data > statisticsSeries > percentiles > 20 - 4.4.3. Property
Job metric data > statisticsSeries > percentiles > 30 - 4.4.4. Property
Job metric data > statisticsSeries > percentiles > 40 - 4.4.5. Property
Job metric data > statisticsSeries > percentiles > 50 - 4.4.6. Property
Job metric data > statisticsSeries > percentiles > 60 - 4.4.7. Property
Job metric data > statisticsSeries > percentiles > 70 - 4.4.8. Property
Job metric data > statisticsSeries > percentiles > 80 - 4.4.9. Property
Job metric data > statisticsSeries > percentiles > 90 - 4.4.10. Property
Job metric data > statisticsSeries > percentiles > 25 - 4.4.11. Property
Job metric data > statisticsSeries > percentiles > 75
- 4.4.1. Property
- 4.1. Property
- 5. Property
Job metric data > series- 5.1. Job metric data > series > series items
Title: Job metric data
| Type | object |
| Required | No |
| Additional properties | Any type allowed |
Description: Metric data of a HPC job
| Property | Pattern | Type | Deprecated | Definition | Title/Description |
|---|---|---|---|---|---|
| + unit | No | object | No | In embedfs://unit.schema.json | Metric unit |
| + timestep | No | integer | No | - | Measurement interval in seconds |
| - thresholds | No | object | No | - | Metric thresholds for specific system |
| - statisticsSeries | No | object | No | - | Statistics series across topology |
| + series | No | array of object | No | - | - |
1. Property Job metric data > unit
| Type | object |
| Required | Yes |
| Additional properties | Any type allowed |
| Defined in | embedfs://unit.schema.json |
Description: Metric unit
2. Property Job metric data > timestep
| Type | integer |
| Required | Yes |
Description: Measurement interval in seconds
3. Property Job metric data > thresholds
| Type | object |
| Required | No |
| Additional properties | Any type allowed |
Description: Metric thresholds for specific system
| Property | Pattern | Type | Deprecated | Definition | Title/Description |
|---|---|---|---|---|---|
| - peak | No | number | No | - | - |
| - normal | No | number | No | - | - |
| - caution | No | number | No | - | - |
| - alert | No | number | No | - | - |
3.1. Property Job metric data > thresholds > peak
| Type | number |
| Required | No |
3.2. Property Job metric data > thresholds > normal
| Type | number |
| Required | No |
3.3. Property Job metric data > thresholds > caution
| Type | number |
| Required | No |
3.4. Property Job metric data > thresholds > alert
| Type | number |
| Required | No |
4. Property Job metric data > statisticsSeries
| Type | object |
| Required | No |
| Additional properties | Any type allowed |
Description: Statistics series across topology
| Property | Pattern | Type | Deprecated | Definition | Title/Description |
|---|---|---|---|---|---|
| - min | No | array of number | No | - | - |
| - max | No | array of number | No | - | - |
| - mean | No | array of number | No | - | - |
| - percentiles | No | object | No | - | - |
4.1. Property Job metric data > statisticsSeries > min
| Type | array of number |
| Required | No |
| Array restrictions | |
|---|---|
| Min items | 3 |
| Max items | N/A |
| Items unicity | False |
| Additional items | False |
| Tuple validation | See below |
| Each item of this array must be | Description |
|---|---|
| min items | - |
4.1.1. Job metric data > statisticsSeries > min > min items
| Type | number |
| Required | No |
| Restrictions | |
|---|---|
| Minimum | ≥ 0 |
4.2. Property Job metric data > statisticsSeries > max
| Type | array of number |
| Required | No |
| Array restrictions | |
|---|---|
| Min items | 3 |
| Max items | N/A |
| Items unicity | False |
| Additional items | False |
| Tuple validation | See below |
| Each item of this array must be | Description |
|---|---|
| max items | - |
4.2.1. Job metric data > statisticsSeries > max > max items
| Type | number |
| Required | No |
| Restrictions | |
|---|---|
| Minimum | ≥ 0 |
4.3. Property Job metric data > statisticsSeries > mean
| Type | array of number |
| Required | No |
| Array restrictions | |
|---|---|
| Min items | 3 |
| Max items | N/A |
| Items unicity | False |
| Additional items | False |
| Tuple validation | See below |
| Each item of this array must be | Description |
|---|---|
| mean items | - |
4.3.1. Job metric data > statisticsSeries > mean > mean items
| Type | number |
| Required | No |
| Restrictions | |
|---|---|
| Minimum | ≥ 0 |
4.4. Property Job metric data > statisticsSeries > percentiles
| Type | object |
| Required | No |
| Additional properties | Any type allowed |
| Property | Pattern | Type | Deprecated | Definition | Title/Description |
|---|---|---|---|---|---|
| - 10 | No | array of number | No | - | - |
| - 20 | No | array of number | No | - | - |
| - 30 | No | array of number | No | - | - |
| - 40 | No | array of number | No | - | - |
| - 50 | No | array of number | No | - | - |
| - 60 | No | array of number | No | - | - |
| - 70 | No | array of number | No | - | - |
| - 80 | No | array of number | No | - | - |
| - 90 | No | array of number | No | - | - |
| - 25 | No | array of number | No | - | - |
| - 75 | No | array of number | No | - | - |
4.4.1. Property Job metric data > statisticsSeries > percentiles > 10
| Type | array of number |
| Required | No |
| Array restrictions | |
|---|---|
| Min items | 3 |
| Max items | N/A |
| Items unicity | False |
| Additional items | False |
| Tuple validation | See below |
| Each item of this array must be | Description |
|---|---|
| 10 items | - |
4.4.1.1. Job metric data > statisticsSeries > percentiles > 10 > 10 items
| Type | number |
| Required | No |
| Restrictions | |
|---|---|
| Minimum | ≥ 0 |
4.4.2. Property Job metric data > statisticsSeries > percentiles > 20
| Type | array of number |
| Required | No |
| Array restrictions | |
|---|---|
| Min items | 3 |
| Max items | N/A |
| Items unicity | False |
| Additional items | False |
| Tuple validation | See below |
| Each item of this array must be | Description |
|---|---|
| 20 items | - |
4.4.2.1. Job metric data > statisticsSeries > percentiles > 20 > 20 items
| Type | number |
| Required | No |
| Restrictions | |
|---|---|
| Minimum | ≥ 0 |
4.4.3. Property Job metric data > statisticsSeries > percentiles > 30
| Type | array of number |
| Required | No |
| Array restrictions | |
|---|---|
| Min items | 3 |
| Max items | N/A |
| Items unicity | False |
| Additional items | False |
| Tuple validation | See below |
| Each item of this array must be | Description |
|---|---|
| 30 items | - |
4.4.3.1. Job metric data > statisticsSeries > percentiles > 30 > 30 items
| Type | number |
| Required | No |
| Restrictions | |
|---|---|
| Minimum | ≥ 0 |
4.4.4. Property Job metric data > statisticsSeries > percentiles > 40
| Type | array of number |
| Required | No |
| Array restrictions | |
|---|---|
| Min items | 3 |
| Max items | N/A |
| Items unicity | False |
| Additional items | False |
| Tuple validation | See below |
| Each item of this array must be | Description |
|---|---|
| 40 items | - |
4.4.4.1. Job metric data > statisticsSeries > percentiles > 40 > 40 items
| Type | number |
| Required | No |
| Restrictions | |
|---|---|
| Minimum | ≥ 0 |
4.4.5. Property Job metric data > statisticsSeries > percentiles > 50
| Type | array of number |
| Required | No |
| Array restrictions | |
|---|---|
| Min items | 3 |
| Max items | N/A |
| Items unicity | False |
| Additional items | False |
| Tuple validation | See below |
| Each item of this array must be | Description |
|---|---|
| 50 items | - |
4.4.5.1. Job metric data > statisticsSeries > percentiles > 50 > 50 items
| Type | number |
| Required | No |
| Restrictions | |
|---|---|
| Minimum | ≥ 0 |
4.4.6. Property Job metric data > statisticsSeries > percentiles > 60
| Type | array of number |
| Required | No |
| Array restrictions | |
|---|---|
| Min items | 3 |
| Max items | N/A |
| Items unicity | False |
| Additional items | False |
| Tuple validation | See below |
| Each item of this array must be | Description |
|---|---|
| 60 items | - |
4.4.6.1. Job metric data > statisticsSeries > percentiles > 60 > 60 items
| Type | number |
| Required | No |
| Restrictions | |
|---|---|
| Minimum | ≥ 0 |
4.4.7. Property Job metric data > statisticsSeries > percentiles > 70
| Type | array of number |
| Required | No |
| Array restrictions | |
|---|---|
| Min items | 3 |
| Max items | N/A |
| Items unicity | False |
| Additional items | False |
| Tuple validation | See below |
| Each item of this array must be | Description |
|---|---|
| 70 items | - |
4.4.7.1. Job metric data > statisticsSeries > percentiles > 70 > 70 items
| Type | number |
| Required | No |
| Restrictions | |
|---|---|
| Minimum | ≥ 0 |
4.4.8. Property Job metric data > statisticsSeries > percentiles > 80
| Type | array of number |
| Required | No |
| Array restrictions | |
|---|---|
| Min items | 3 |
| Max items | N/A |
| Items unicity | False |
| Additional items | False |
| Tuple validation | See below |
| Each item of this array must be | Description |
|---|---|
| 80 items | - |
4.4.8.1. Job metric data > statisticsSeries > percentiles > 80 > 80 items
| Type | number |
| Required | No |
| Restrictions | |
|---|---|
| Minimum | ≥ 0 |
4.4.9. Property Job metric data > statisticsSeries > percentiles > 90
| Type | array of number |
| Required | No |
| Array restrictions | |
|---|---|
| Min items | 3 |
| Max items | N/A |
| Items unicity | False |
| Additional items | False |
| Tuple validation | See below |
| Each item of this array must be | Description |
|---|---|
| 90 items | - |
4.4.9.1. Job metric data > statisticsSeries > percentiles > 90 > 90 items
| Type | number |
| Required | No |
| Restrictions | |
|---|---|
| Minimum | ≥ 0 |
4.4.10. Property Job metric data > statisticsSeries > percentiles > 25
| Type | array of number |
| Required | No |
| Array restrictions | |
|---|---|
| Min items | 3 |
| Max items | N/A |
| Items unicity | False |
| Additional items | False |
| Tuple validation | See below |
| Each item of this array must be | Description |
|---|---|
| 25 items | - |
4.4.10.1. Job metric data > statisticsSeries > percentiles > 25 > 25 items
| Type | number |
| Required | No |
| Restrictions | |
|---|---|
| Minimum | ≥ 0 |
4.4.11. Property Job metric data > statisticsSeries > percentiles > 75
| Type | array of number |
| Required | No |
| Array restrictions | |
|---|---|
| Min items | 3 |
| Max items | N/A |
| Items unicity | False |
| Additional items | False |
| Tuple validation | See below |
| Each item of this array must be | Description |
|---|---|
| 75 items | - |
4.4.11.1. Job metric data > statisticsSeries > percentiles > 75 > 75 items
| Type | number |
| Required | No |
| Restrictions | |
|---|---|
| Minimum | ≥ 0 |
5. Property Job metric data > series
| Type | array of object |
| Required | Yes |
| Array restrictions | |
|---|---|
| Min items | N/A |
| Max items | N/A |
| Items unicity | False |
| Additional items | False |
| Tuple validation | See below |
| Each item of this array must be | Description |
|---|---|
| series items | - |
5.1. Job metric data > series > series items
| Type | object |
| Required | No |
| Additional properties | Any type allowed |
| Property | Pattern | Type | Deprecated | Definition | Title/Description |
|---|---|---|---|---|---|
| + hostname | No | string | No | - | - |
| - id | No | string | No | - | - |
| + statistics | No | object | No | - | Statistics across time dimension |
| + data | No | array | No | - | - |
5.1.1. Property Job metric data > series > series items > hostname
| Type | string |
| Required | Yes |
5.1.2. Property Job metric data > series > series items > id
| Type | string |
| Required | No |
5.1.3. Property Job metric data > series > series items > statistics
| Type | object |
| Required | Yes |
| Additional properties | Any type allowed |
Description: Statistics across time dimension
| Property | Pattern | Type | Deprecated | Definition | Title/Description |
|---|---|---|---|---|---|
| + avg | No | number | No | - | Series average |
| + min | No | number | No | - | Series minimum |
| + max | No | number | No | - | Series maximum |
5.1.3.1. Property Job metric data > series > series items > statistics > avg
| Type | number |
| Required | Yes |
Description: Series average
| Restrictions | |
|---|---|
| Minimum | ≥ 0 |
5.1.3.2. Property Job metric data > series > series items > statistics > min
| Type | number |
| Required | Yes |
Description: Series minimum
| Restrictions | |
|---|---|
| Minimum | ≥ 0 |
5.1.3.3. Property Job metric data > series > series items > statistics > max
| Type | number |
| Required | Yes |
Description: Series maximum
| Restrictions | |
|---|---|
| Minimum | ≥ 0 |
5.1.4. Property Job metric data > series > series items > data
| Type | array |
| Required | Yes |
| Array restrictions | |
|---|---|
| Min items | 1 |
| Max items | N/A |
| Items unicity | False |
| Additional items | False |
| Tuple validation | See below |
5.1.4.1. At least one of the items must be
| Type | number |
| Required | No |
| Restrictions | |
|---|---|
| Minimum | ≥ 0 |
Generated using json-schema-for-humans on 2024-12-04 at 16:45:59 +0100
7.1.8 - Tools
This section documents the command-line tools included with ClusterCockpit for various maintenance, migration, and administrative tasks.
Available Tools
Archive Management
- archive-manager: Comprehensive job archive management, validation, cleaning, and import/export
- archive-migration: Migrate job archives between schema versions
Security & Authentication
- gen-keypair: Generate Ed25519 keypairs for JWT signing and validation
- convert-pem-pubkey: Convert external Ed25519 PEM keys to ClusterCockpit format
Diagnostics
- grepCCLog.pl: Analyze log files to identify non-archived jobs
Data Generation for cc-metric-store
- dataGenerator.sh: Connect to cc-metric-store (external or internal) and push data at 1 minute interval.
Building Tools
All Go-based tools follow the same build pattern:
cd tools/<tool-name>
go build
Common Features
Most tools support:
- Configurable logging levels (
-loglevel) - Timestamped log output (
-logdate) - Configuration file specification (
-config)
7.1.8.1 - archive-manager
The archive-manager tool provides comprehensive management and maintenance capabilities for ClusterCockpit job archives. It supports validation, cleaning, importing between different archive backends, and general archive operations.
Build
cd tools/archive-manager
go build
Command-Line Options
-s <path>
Function: Specify the source job archive path.
Default: ./var/job-archive
Example: -s /data/job-archive
-config <path>
Function: Specify alternative path to config.json.
Default: ./config.json
Example: -config /etc/clustercockpit/config.json
-validate
Function: Validate a job archive against the JSON schema.
-remove-cluster <cluster>
Function: Remove specified cluster from archive and database.
Example: -remove-cluster oldcluster
-remove-before <date>
Function: Remove all jobs with start time before the specified date.
Format: 2006-Jan-04
Example: -remove-before 2023-Jan-01
-remove-after <date>
Function: Remove all jobs with start time after the specified date.
Format: 2006-Jan-04
Example: -remove-after 2024-Dec-31
-import
Function: Import jobs from source archive to destination archive.
Note: Requires -src-config and -dst-config options.
-convert
Function: Convert an archive between JSON and Parquet formats.
Note: Requires -src-config and -dst-config options. Use -format to specify
the output format.
-format <format>
Function: Output format for archive conversion.
Arguments: json | parquet
Default: json
Example: -format parquet
-max-file-size <n>
Function: Maximum Parquet file size in MB before splitting into a new file.
Only relevant when -format parquet is used.
Default: 512
Example: -max-file-size 256
-src-config <json>
Function: Source archive backend configuration in JSON format.
Example: -src-config '{"kind":"file","path":"./archive"}'
-dst-config <json>
Function: Destination archive backend configuration in JSON format.
Example: -dst-config '{"kind":"sqlite","dbPath":"./archive.db"}'
-loglevel <level>
Function: Sets the logging level.
Arguments: debug | info | warn | err | fatal | crit
Default: info
Example: -loglevel debug
-logdate
Function: Set this flag to add date and time to log messages.
Usage Examples
Validate Archive
./archive-manager -s /data/job-archive -validate
Clean Old Jobs
# Remove jobs older than January 1, 2023
./archive-manager -s /data/job-archive -remove-before 2023-Jan-01
Import Between Archives
# Import from file-based archive to SQLite archive
./archive-manager -import \
  -src-config '{"kind":"file","path":"./old-archive"}' \
  -dst-config '{"kind":"sqlite","dbPath":"./new-archive.db"}'
Convert Archive Format
# Convert JSON file archive to Parquet format
./archive-manager -convert \
  -src-config '{"kind":"file","path":"./job-archive"}' \
  -dst-config '{"kind":"s3","endpoint":"http://minio:9000","bucket":"parquet-archive","access-key":"key","secret-key":"secret"}' \
  -format parquet

# Convert Parquet archive back to JSON file archive
./archive-manager -convert \
  -src-config '{"kind":"s3","endpoint":"http://minio:9000","bucket":"parquet-archive","access-key":"key","secret-key":"secret"}' \
  -dst-config '{"kind":"file","path":"./job-archive-restored"}' \
  -format json
Archive Information
# Display archive statistics
./archive-manager -s /data/job-archive
Features
- Validation: Verify job archive integrity against JSON schemas
- Cleaning: Remove jobs by date range or cluster
- Import/Export: Transfer jobs between different archive backend types
- Format Conversion: Convert archives between JSON and Parquet formats
- Statistics: Display archive information and job counts
- Progress Tracking: Real-time progress reporting for long operations
7.1.8.2 - archive-migration
The archive-migration tool migrates job archives from old schema versions to the current schema version. It handles schema changes such as the exclusive → shared field transformation and adds/removes fields as needed.
Features
- Parallel Processing: Uses worker pool for fast migration
- Dry-Run Mode: Preview changes without modifying files
- Safe Transformations: Applies well-defined schema transformations
- Progress Reporting: Shows real-time migration progress
- Error Handling: Continues on individual failures, reports at end
Build
cd tools/archive-migration
go build
Command-Line Options
-archive <path>
Function: Path to job archive to migrate (required).
Example: -archive /data/job-archive
-dry-run
Function: Preview changes without modifying files.
-workers <n>
Function: Number of parallel workers.
Default: 4
Example: -workers 8
-loglevel <level>
Function: Sets the logging level.
Arguments: debug | info | warn | err | fatal | crit
Default: info
Example: -loglevel debug
-logdate
Function: Add date and time to log messages.
Schema Transformations
Exclusive → Shared
Converts the old exclusive integer field to the new shared string field:
0→"multi_user"1→"none"2→"single_user"
Missing Fields
Adds fields required by current schema:
submitTime: Defaults tostartTimeif missingenergy: Defaults to0.0requestedMemory: Defaults to0shared: Defaults to"none"if still missing after transformation
Deprecated Fields
Removes fields no longer in schema:
mem_used_max,flops_any_avg,mem_bw_avgload_avg,net_bw_avg,net_data_vol_totalfile_bw_avg,file_data_vol_total
Usage Examples
Preview Changes (Dry Run)
./archive-migration --archive /data/job-archive --dry-run
Migrate Archive
# IMPORTANT: Backup your archive first!
cp -r /data/job-archive /data/job-archive-backup

# Run migration
./archive-migration --archive /data/job-archive
Migrate with Verbose Logging
./archive-migration --archive /data/job-archive --loglevel debug
Migrate with More Workers
./archive-migration --archive /data/job-archive --workers 8
Safety
The tool modifies meta.json files in place. While transformations are designed to be safe, unexpected issues could occur. Follow these safety practices:
- Always run with
--dry-runfirst to preview changes - Backup your archive before migration
- Test on a copy of your archive first
- Verify results after migration
Verification
After migration, verify the archive:
# Use archive-manager to check the archive
cd ../archive-manager
./archive-manager -s /data/migrated-archive

# Or validate specific jobs
./archive-manager -s /data/migrated-archive --validate
Troubleshooting
Migration Failures
If individual jobs fail to migrate:
- Check the error messages for specific files
- Examine the failing
meta.jsonfiles manually - Fix invalid JSON or unexpected field types
- Re-run migration (already-migrated jobs will be processed again)
Performance
For large archives:
- Increase
--workersfor more parallelism - Use
--loglevel warnto reduce log output - Monitor disk I/O if migration is slow
Technical Details
The migration process:
- Walks archive directory recursively
- Finds all
meta.jsonfiles - Distributes jobs to worker pool
- For each job:
- Reads JSON file
- Applies transformations in order
- Writes back migrated data (if not dry-run)
- Reports statistics and errors
Transformations are idempotent - running migration multiple times is safe (though not recommended for performance).
7.1.8.3 - convert-pem-pubkey
The convert-pem-pubkey tool converts an Ed25519 public key from PEM format to the base64 format used by ClusterCockpit for JWT validation.
Use Case
When you have externally generated JSON Web Tokens (JWT) that should be accepted by cc-backend, the external provider shares its public key (used for JWT signing) in PEM format. ClusterCockpit requires this key in a different format, which this tool provides.
Build
cd tools/convert-pem-pubkey
go build
Usage
Input Format (PEM)
-----BEGIN PUBLIC KEY-----
MCowBQYDK2VwAyEA+51iXX8BdLFocrppRxIw52xCOf8xFSH/eNilN5IHVGc=
-----END PUBLIC KEY-----
Convert Key
# Insert your public Ed25519 PEM key into dummy.pub
echo "-----BEGIN PUBLIC KEY-----
MCowBQYDK2VwAyEA+51iXX8BdLFocrppRxIw52xCOf8xFSH/eNilN5IHVGc=
-----END PUBLIC KEY-----" > dummy.pub

# Run conversion
go run . dummy.pub
Output Format
CROSS_LOGIN_JWT_PUBLIC_KEY="+51iXX8BdLFocrppRxIw52xCOf8xFSH/eNilN5IHVGc="
Configuration
- Copy the output into ClusterCockpit’s
.envfile - Restart ClusterCockpit backend
- ClusterCockpit can now validate JWTs from the external provider
Command-Line Arguments
convert-pem-pubkey <pem-file>
Arguments: Path to PEM-encoded Ed25519 public key file
Example: go run . dummy.pub
Example Workflow
# 1. Navigate to tool directory
cd tools/convert-pem-pubkey

# 2. Save external provider's PEM key
cat > external-key.pub <<EOF
-----BEGIN PUBLIC KEY-----
MCowBQYDK2VwAyEA+51iXX8BdLFocrppRxIw52xCOf8xFSH/eNilN5IHVGc=
-----END PUBLIC KEY-----
EOF

# 3. Convert to ClusterCockpit format
go run . external-key.pub

# 4. Add output to .env file
# CROSS_LOGIN_JWT_PUBLIC_KEY="+51iXX8BdLFocrppRxIw52xCOf8xFSH/eNilN5IHVGc="

# 5. Restart cc-backend
Technical Details
The tool:
- Reads Ed25519 public key in PEM format
- Extracts the raw key bytes
- Encodes to base64 string
- Outputs in ClusterCockpit’s expected format
This enables ClusterCockpit to validate JWTs signed by external providers using their Ed25519 keys.
7.1.8.4 - gen-keypair
The gen-keypair tool generates a new Ed25519 keypair for signing and validating JWT tokens in ClusterCockpit.
Purpose
Generates a cryptographically secure Ed25519 public/private keypair that can be used for:
- JWT token signing (private key)
- JWT token validation (public key)
Build
cd tools/gen-keypair
go build
Usage
go run .
Or after building:
./gen-keypair
Output
The tool outputs a keypair in base64-encoded format:
ED25519 PUBLIC_KEY="<base64-encoded-public-key>"
ED25519 PRIVATE_KEY="<base64-encoded-private-key>"
This is NO JWT token. You can generate JWT tokens with cc-backend. Use this keypair for signing and validation of JWT tokens in ClusterCockpit.
Configuration
Add the generated keys to ClusterCockpit’s configuration:
Option 1: Environment Variables (.env file)
ED25519_PUBLIC_KEY="<base64-encoded-public-key>"
ED25519_PRIVATE_KEY="<base64-encoded-private-key>"
Option 2: Configuration File (config.json)
{
  "jwts": {
    "publicKey": "<base64-encoded-public-key>",
    "privateKey": "<base64-encoded-private-key>"
  }
}
Example Workflow
# 1. Generate keypair
cd tools/gen-keypair
go run . > keypair.txt

# 2. View generated keys
cat keypair.txt

# 3. Add to .env file (manual or scripted)
grep PUBLIC_KEY keypair.txt >> ../../.env
grep PRIVATE_KEY keypair.txt >> ../../.env

# 4. Restart cc-backend to use new keys
Security Notes
- The private key must be kept secret
- Store private keys securely (file permissions, encryption at rest)
- Use environment variables or secure configuration management
- Do not commit private keys to version control
- Rotate keys periodically for enhanced security
Technical Details
The tool uses:
- Go’s
crypto/ed25519package /dev/urandomas entropy source on Linux- Base64 standard encoding for output format
Ed25519 provides:
- Fast signature generation and verification
- Small key and signature sizes
- Strong security guarantees
7.1.8.5 - grepCCLog.pl
The grepCCLog.pl script analyzes ClusterCockpit log files to identify jobs that were started but not yet archived on a specific day. This is useful for troubleshooting and monitoring job lifecycle.
Purpose
Parses ClusterCockpit log files to:
- Identify jobs that started on a specific day
- Detect jobs that have not been archived
- Generate statistics per user
- Report jobs that may be stuck or still running
Usage
./grepCCLog.pl <logfile> <day>
Arguments
<logfile>
Function: Path to ClusterCockpit log file
Example: /var/log/clustercockpit/cc-backend.log
<day>
Function: Day of month to analyze (numeric)
Example: 15 (for October 15th)
Output
The script produces:
- List of Non-Archived Jobs: Details for each job that started but hasn’t been archived
- Per-User Summary: Count of non-archived jobs per user
- Total Statistics: Overall count of started vs. non-archived jobs
Example Output
======
jobID:  12345 User:  alice
======
======
jobID:  12346 User:  bob
======
alice => 1
bob => 1
Not stopped: 2 of 10
Log Format Requirements
The script expects log entries in the following format:
Job Start Entry
Oct 15 ... new job (id: 123): cluster=woody, jobId=12345, user=alice, ...
Job Archive Entry
Oct 15 ... archiving job... (dbid: 123): cluster=woody, jobId=12345, user=alice, ...
Limitations
- Hard-coded for cluster name
woody - Hard-coded for month
Oct - Requires specific log message format
- Day must match exactly
Customization
To adapt for your environment, modify the script:
# Line 19: Change cluster name
if ( $cluster eq 'your-cluster-name' && $day eq $Tday  ) {

# Line 35: Change cluster name for archive matching
if ( $cluster eq 'your-cluster-name' ) {

# Lines 12 & 28: Update month pattern
if ( /Oct ([0-9]+) .../ ) {
# Change 'Oct' to your desired month
Use Cases
- Debugging: Identify jobs that failed to archive properly
- Monitoring: Track running jobs for a specific day
- Troubleshooting: Find stuck jobs in the system
- Auditing: Verify job lifecycle completion
Example Workflow
# Analyze today's jobs (e.g., October 15)
./grepCCLog.pl /var/log/cc-backend.log 15

# Find jobs started on the 20th
./grepCCLog.pl /var/log/cc-backend.log 20

# Check specific log file
./grepCCLog.pl /path/to/old-logs/cc-backend-2024-10.log 15
Technical Details
The script:
- Opens specified log file
- Parses log entries with regex patterns
- Tracks started jobs in hash table
- Tracks archived jobs in separate hash table
- Compares to find jobs without archive entry
- Aggregates statistics per user
- Outputs results
Jobs are matched by database ID (id: field) between start and archive entries.
7.1.8.6 - Metric Generator Script
Overview
The Metric Generator is a bash script designed to simulate high-frequency metric data for the alex and fritz clusters. It is primarily used for testing the connection to cc-metric-store and put dummy data into it. This can either be your separately hoster cc-metric-store (which is what we call external mode) or your integrated cc-metric-store into cc-backend (which is what we call internal cc-metric-store).
The script supports two transport mechanisms:
- REST API (via
curl) - NATS Messaging (via
nats-cli)
It also supports two deployment scopes to handle different URL structures and authentication methods:
- Internal (Integrated cc-metric-store into cc-backend)
- External (Self-hosted separate cc-metric-store)
Configuration
The script behavior is controlled by variables defined at the top of the file.
Main Operation Flags
| Variable | Options | Description |
|---|---|---|
TRANSPORT_MODE | "REST" / "NATS" | REST: Sends HTTP POST requests. NATS: Publishes to a NATS subject. |
CONNECTION_SCOPE | "INTERNAL" / "EXTERNAL" | INTERNAL: To use integrated cc-metric-store. EXTERNAL: To use self-hosted separate cc-metric-store. |
API_USER | String (e.g., "demo") | The username used to generate the JWT when in INTERNAL mode. |
Network Settings
| Variable | Description | Required Mode |
|---|---|---|
SERVICE_ADDRESS | Base URL of the API (e.g., http://localhost:8080). | REST |
NATS_SERVER | NATS connection string (e.g., nats://0.0.0.0:4222). | NATS |
NATS_SUBJECT | The subject topic to publish messages to (e.g., hpc-nats). | NATS |
JWT_STATIC | A hardcoded Bearer token used for authentication. | EXTERNAL |
Logic & Behavior
Connection Scopes (REST Mode)
The script automatically adjusts the target URL and Authentication method based on the CONNECTION_SCOPE.
| Feature | Scope: INTERNAL | Scope: EXTERNAL |
|---|---|---|
| Target URL | {SERVICE_ADDRESS}/metricstore/api/write | {SERVICE_ADDRESS}/api/write |
| Authentication | Dynamic: Executes ./cc-backend -jwt "$API_USER" | Static: Uses JWT_STATIC variable |
Transport Modes
- REST: The script writes a batch of metrics to a temporary file and uses
curlto POST the file binary to the configured URL. - NATS: The script writes a batch of metrics to a temporary file and pipes (
|) the content directly to thenats pubcommand.
Data Specifications
The script generates InfluxDB/Line Protocol formatted text. It iterates through varying hardware hierarchies for two clusters: Alex and Fritz.
1. Metric Dimensions (Tags)
Every data point includes the following tags:
cluster:alexorfritzhostname: A random host from the predefined host lists.type: The hardware level (see below).type-id: The specific index or ID of the hardware component.
2. Hierarchy Levels
| Hierarchy Type | ID Format | Count | Notes |
|---|---|---|---|
hwthread | Integer | 0..127 (Alex) / 0..71 (Fritz) | Highest volume metric |
accelerator | PCI Address | 8 per node | Alex Only |
memoryDomain | Integer | 0..7 | Alex Only |
socket | Integer | 0..1 | All Clusters |
node | N/A | 1 per host | All Clusters |
3. Metric Fields
Standard Metrics (hwthread, socket, accelerator, memoryDomain):
cpu_load,cpu_user,flops_any,cpu_irq,cpu_system,ipc,cpu_idle,cpu_iowait,core_power,clock
Node Metrics (node):
cpu_irq,cpu_load,mem_cached,net_bytes_in,cpu_user,cpu_idle,nfs4_read,mem_used,nfs4_write,nfs4_total,ib_xmit,ib_xmit_pkts,net_bytes_out,cpu_iowait,ib_recv,cpu_system,ib_recv_pkts
Usage Examples
1. Run for Internal CCMS
Set the variables inside the script:
TRANSPORT_MODE="REST"
CONNECTION_SCOPE="INTERNAL"
Effect: Generates a new token using cc-backend and posts to /metricstore/api/write.
2. Run for External CCMS
Set the variables inside the script:
TRANSPORT_MODE="REST"
CONNECTION_SCOPE="EXTERNAL"
Effect: Uses the static JWT and posts to /api/write.
3. Run as NATS Publisher
Set the variables inside the script:
TRANSPORT_MODE="NATS"
Effect: Pipes data directly to the NATS server on hpc-nats.
7.2 - cc-metric-store
Reference information regarding the ClusterCockpit component “cc-metric-store” (GitHub Repo).
Query Requests
The metric store provides a flexible API for querying time-series metric data with support for hierarchical selectors, aggregation, and scope transformation.
APIQueryRequest
The main request structure for batch metric queries.
type APIQueryRequest struct {
    Cluster     string     `json:"cluster"`
    Queries     []APIQuery `json:"queries"`
    ForAllNodes []string   `json:"for-all-nodes"`
    From        int64      `json:"from"`
    To          int64      `json:"to"`
    WithStats   bool       `json:"with-stats"`
    WithData    bool       `json:"with-data"`
    WithPadding bool       `json:"with-padding"`
}
Fields:
Cluster(string): The cluster name to queryQueries([]APIQuery): List of individual metric queries (see below)ForAllNodes([]string): Alternative to explicit queries - automatically generates queries for all specified metrics across all nodes in the clusterFrom(int64): Start timestamp (Unix epoch seconds)To(int64): End timestamp (Unix epoch seconds)WithStats(bool): Include computed statistics (avg, min, max) in responseWithData(bool): Include raw time-series data in responseWithPadding(bool): Pad data arrays with NaN values to align with requested time range
Query Modes:
- Explicit Queries: Specify individual queries via the
Queriesfield for fine-grained control - Batch Mode: Use
ForAllNodesto automatically query all specified metrics for all nodes in the cluster
Validation:
Frommust be less thanTo(returnsErrInvalidTimeRangeotherwise)Clusteris required when usingForAllNodes(returnsErrEmptyClusterotherwise)
APIQuery
Represents a single metric query with optional hierarchical selectors.
type APIQuery struct {
    Type        *string      `json:"type,omitempty"`
    SubType     *string      `json:"subtype,omitempty"`
    Metric      string       `json:"metric"`
    Hostname    string       `json:"host"`
    Resolution  int64        `json:"resolution"`
    TypeIds     []string     `json:"type-ids,omitempty"`
    SubTypeIds  []string     `json:"subtype-ids,omitempty"`
    ScaleFactor schema.Float `json:"scale-by,omitempty"`
    Aggregate   bool         `json:"aggreg"`
}
Fields:
Metric(string, required): The metric name to query (e.g., “cpu_load”, “mem_used”)Hostname(string, required): The node hostname to queryType(*string, optional): First level of hierarchy (e.g., “hwthread”, “core”, “socket”, “accelerator”, “memorydomain”)TypeIds([]string, optional): IDs for the Type level (e.g., [“0”, “1”, “2”] for cores 0-2)SubType(*string, optional): Second level of hierarchy (for nested selectors)SubTypeIds([]string, optional): IDs for the SubType levelResolution(int64): Data resolution in seconds (0 = native resolution)ScaleFactor(float, optional): Multiply all data points by this factor (for unit conversion)Aggregate(bool): If true, aggregate data from multiple TypeIds/SubTypeIds; if false, return separate results for each
Hierarchical Selection:
The query system supports hierarchical data selection:
Cluster → Hostname → Type+TypeIds → SubType+SubTypeIds
Examples:
// Query node-level CPU load
{
  "metric": "cpu_load",
  "host": "node001",
  "resolution": 60
}

// Query per-core CPU load (non-aggregated)
{
  "metric": "cpu_load",
  "host": "node001",
  "type": "core",
  "type-ids": ["0", "1", "2", "3"],
  "aggreg": false,
  "resolution": 60
}

// Query aggregated socket memory bandwidth
{
  "metric": "mem_bw",
  "host": "node001",
  "type": "socket",
  "type-ids": ["0", "1"],
  "aggreg": true,
  "resolution": 60
}

// Query GPU metrics
{
  "metric": "gpu_power",
  "host": "node001",
  "type": "accelerator",
  "type-ids": ["0", "1", "2", "3"],
  "aggreg": false,
  "resolution": 60
}
APIQueryResponse
The response structure containing query results.
type APIQueryResponse struct {
    Queries []APIQuery        `json:"queries,omitempty"`
    Results [][]APIMetricData `json:"results"`
}
Fields:
Queries([]APIQuery, optional): Echo of the queries executed (populated when usingForAllNodes)Results([][]APIMetricData): 2D array of results where:- Outer array: One element per query
- Inner array: One element per selector (e.g., multiple cores/sockets when
Aggregate=false)
APIMetricData
Represents the response data for a single metric query.
type APIMetricData struct {
    Error      *string           `json:"error,omitempty"`
    Data       schema.FloatArray `json:"data,omitempty"`
    From       int64             `json:"from"`
    To         int64             `json:"to"`
    Resolution int64             `json:"resolution"`
    Avg        schema.Float      `json:"avg"`
    Min        schema.Float      `json:"min"`
    Max        schema.Float      `json:"max"`
}
Fields:
Data([]float): Time-series data points (omitted ifWithData=false)From(int64): Actual start timestamp of returned dataTo(int64): Actual end timestamp of returned dataResolution(int64): Actual resolution of returned data in secondsAvg(float): Average value (only ifWithStats=true)Min(float): Minimum value (only ifWithStats=true)Max(float): Maximum value (only ifWithStats=true)Error(*string, optional): Error message if query failed
Notes:
- NaN values in data are ignored during statistics computation
- If all values are NaN, statistics will be NaN
- Missing hosts or metrics result in empty results (not errors) for graceful frontend handling
Metric Scopes
Metrics are collected at different granularities (native scope):
- HWThread: Per hardware thread
- Core: Per CPU core
- Socket: Per CPU socket
- MemoryDomain: Per memory domain (NUMA)
- Accelerator: Per GPU/accelerator
- Node: Per compute node
Scope Transformation
The query system automatically transforms between native metric scope and requested scope:
- Aggregation (native scope ≥ requested scope): Finer-grained data is aggregated to coarser granularity
- Example: HWThread → Core → Socket → Node
- Rejection (native scope < requested scope): Cannot increase granularity - returns error
- Special Cases: Accelerator metrics are independent of CPU hierarchy
Transformation Rules:
| Native Scope | Requested Scope | Result |
|---|---|---|
| HWThread | HWThread | Direct query |
| HWThread | Core | Aggregate HWThreads per core |
| HWThread | Socket | Aggregate HWThreads per socket |
| HWThread | Node | Aggregate all HWThreads |
| Core | Core | Direct query |
| Core | Socket | Aggregate cores per socket |
| Core | Node | Aggregate all cores |
| Socket | Socket | Direct query |
| Socket | Node | Aggregate all sockets |
| Node | Node | Direct query |
| Accelerator | Accelerator | Direct query |
| Accelerator | Node | Aggregate all accelerators |
Error Handling
The API uses a hybrid error model:
Request-level errors: Returned as HTTP errors
ErrInvalidTimeRange:From≥ToErrEmptyCluster: Missing cluster name withForAllNodes- Uninitialized metric store
Query-level errors: Stored in
APIMetricData.Errorfield- Individual query failures don’t fail the entire request
- Missing hosts/metrics are logged as warnings but return empty results
Partial errors: When some queries succeed and others fail
- Successful data is returned
- Error messages are collected and returned as a combined error
Complete Example
{
  "cluster": "fritz",
  "from": 1609459200,
  "to": 1609462800,
  "with-stats": true,
  "with-data": true,
  "queries": [
    {
      "metric": "cpu_load",
      "host": "node001",
      "resolution": 60
    },
    {
      "metric": "mem_used",
      "host": "node001",
      "type": "socket",
      "type-ids": ["0", "1"],
      "aggreg": false,
      "resolution": 60
    }
  ]
}
Response:
{
  "results": [
    [
      {
        "data": [0.5, 0.6, 0.7, ...],
        "from": 1609459200,
        "to": 1609462800,
        "resolution": 60,
        "avg": 0.6,
        "min": 0.5,
        "max": 0.7
      }
    ],
    [
      {
        "data": [1024.0, 1536.0, 2048.0, ...],
        "from": 1609459200,
        "to": 1609462800,
        "resolution": 60,
        "avg": 1536.0,
        "min": 1024.0,
        "max": 2048.0
      },
      {
        "data": [2048.0, 2560.0, 3072.0, ...],
        "from": 1609459200,
        "to": 1609462800,
        "resolution": 60,
        "avg": 2560.0,
        "min": 2048.0,
        "max": 3072.0
      }
    ]
  ]
}
7.2.1 - Command Line
This page describes the command line options for the cc-metric-store executable.
-config <path>
Function: Specifies alternative path to application configuration file.
Default: ./config.json
Example: -config ./configfiles/configuration.json
-dev
Function: Enables the Swagger UI REST API documentation and playground at /swagger/.
-gops
Function: Go server listens via github.com/google/gops/agent (for debugging).
-loglevel <level>
Function: Sets the logging level.
Options: debug, info, warn (default), err, crit
Example: -loglevel debug
-logdate
Function: Add date and time to log messages.
-version
Function: Shows version information and exits.
Running
./cc-metric-store                              # Uses ./config.json
./cc-metric-store -config /path/to/config.json # Custom config path
./cc-metric-store -dev                         # Enable Swagger UI at /swagger/
./cc-metric-store -loglevel debug              # Verbose logging
Example Configuration
See Configuration Reference for detailed descriptions of all options.
{
  "main": {
    "addr": "localhost:8080",
    "jwt-public-key": "kzfYrYy+TzpanWZHJ5qSdMj5uKUWgq74BWhQG6copP0="
  },
  "metrics": {
    "clock": {
      "frequency": 60,
      "aggregation": "avg"
    },
    "cpu_idle": {
      "frequency": 60,
      "aggregation": "avg"
    },
    "cpu_iowait": {
      "frequency": 60,
      "aggregation": "avg"
    },
    "cpu_irq": {
      "frequency": 60,
      "aggregation": "avg"
    },
    "cpu_system": {
      "frequency": 60,
      "aggregation": "avg"
    },
    "cpu_user": {
      "frequency": 60,
      "aggregation": "avg"
    },
    "acc_utilization": {
      "frequency": 60,
      "aggregation": "avg"
    },
    "acc_mem_used": {
      "frequency": 60,
      "aggregation": "sum"
    },
    "acc_power": {
      "frequency": 60,
      "aggregation": "sum"
    },
    "flops_any": {
      "frequency": 60,
      "aggregation": "sum"
    },
    "flops_dp": {
      "frequency": 60,
      "aggregation": "sum"
    },
    "flops_sp": {
      "frequency": 60,
      "aggregation": "sum"
    },
    "ib_recv": {
      "frequency": 60,
      "aggregation": "sum"
    },
    "ib_xmit": {
      "frequency": 60,
      "aggregation": "sum"
    },
    "cpu_power": {
      "frequency": 60,
      "aggregation": "sum"
    },
    "mem_power": {
      "frequency": 60,
      "aggregation": "sum"
    },
    "ipc": {
      "frequency": 60,
      "aggregation": "avg"
    },
    "cpu_load": {
      "frequency": 60,
      "aggregation": null
    },
    "mem_bw": {
      "frequency": 60,
      "aggregation": "sum"
    },
    "mem_used": {
      "frequency": 60,
      "aggregation": null
    }
  },
  "metric-store": {
    "checkpoints": {
      "interval": "12h",
      "directory": "./var/checkpoints"
    },
    "memory-cap": 100,
    "retention-in-memory": "48h",
    "cleanup": {
      "mode": "archive",
      "interval": "48h",
      "directory": "./var/archive"
    }
  }
}
7.2.2 - Configuration
Configuration options are located in a JSON file. Default path is config.json
in current working directory. Alternative paths to the configuration file can be
specified using the command line switch -config <filename>.
All durations are specified as string that will be parsed like
this (Allowed suffixes: s, m, h,
…).
The configuration is organized into four main sections: main, metrics,
nats, and metric-store.
Main Section
main: Server configuration (required)addr: Address to bind to, for examplelocalhost:8080or0.0.0.0:443(required)https-cert-file: Filepath to SSL certificate. If alsohttps-key-fileis set, use HTTPS (optional)https-key-file: Filepath to SSL key file. If alsohttps-cert-fileis set, use HTTPS (optional)user: Drop root permissions to this user once the port was bound. Only applicable if using privileged port (optional)group: Drop root permissions to this group once the port was bound. Only applicable if using privileged port (optional)backend-url: URL of cc-backend for querying job information, e.g.,https://localhost:8080(optional)jwt-public-key: Base64 encoded Ed25519 public key, use this to verify requests to the HTTP API (required)debug: Debug options (optional)dump-to-file: Path to file for dumping internal state (optional)gops: Enable gops agent for debugging (optional)
Metrics Section
metrics: Map of metric-name to objects with the following properties (required)frequency: Timestep/Interval/Resolution of this metric in seconds (required)aggregation: Can be"sum","avg"ornull(required)nullmeans aggregation across topology levels is disabled for this metric (use for node-scope-only metrics)"sum"means that values from the child levels are summed up for the parent level"avg"means that values from the child levels are averaged for the parent level
NATS Section
nats: NATS server connection configuration (optional)address: URL of NATS.io server, example:nats://localhost:4222(required if nats section present)username: NATS username for authentication (optional)password: NATS password for authentication (optional)
Metric-Store Section
metric-store: Storage engine configuration (required)retention-in-memory: Keep all values in memory for at least that amount of time. Should be long enough to cover common job durations (required)memory-cap: Upper memory capacity limit used by the metric store in GB (required). If exceeded, buffers still in use by long-running jobs will be freed.num-workers: Number of concurrent workers for checkpoint and archive operations (optional). Defaults tomin(NumCPU/2+1, 10).checkpoints: Checkpoint configuration (optional)file-format: Format for checkpoint files. Either"json"(human-readable, periodic) or"wal"(binary snapshot + Write-Ahead Log, crash-safe). Default:"wal"(optional)directory: Path to checkpoint directory. Default:./var/checkpoints(optional)
cleanup: Cleanup/archiving configuration (optional). The cleanup interval always equalsretention-in-memory. Defaults tomode: deleteif not set.mode: Either"archive"(move old checkpoints to archive directory) or"delete"(remove old checkpoints). Default:"delete"(optional)directory: Path to archive directory (required if mode is"archive")
nats-subscriptions: Array of NATS subscription configurations (optional, requiresnatssection)subscribe-to: NATS subject to subscribe to (required)cluster-tag: Default cluster tag for metrics without a cluster tag (optional)
7.2.3 - Metric Store REST API
Authentication
JWT tokens
cc-metric-store supports only JWT tokens using the EdDSA/Ed25519 signing
method. The token is provided using the Authorization Bearer header.
Example script to test the endpoint:
# Only use JWT token if the JWT authentication has been setup
JWT="eyJ0eXAiOiJKV1QiLCJhbGciOiJFZERTQSJ9.eyJ1c2VyIjoiYWRtaW4iLCJyb2xlcyI6WyJST0xFX0FETUlOIiwiUk9MRV9BTkFMWVNUIiwiUk9MRV9VU0VSIl19.d-3_3FZTsadPjDEdsWrrQ7nS0edMAR4zjl-eK7rJU3HziNBfI9PDHDIpJVHTNN5E5SlLGLFXctWyKAkwhXL-Dw"

curl -X 'GET' 'http://localhost:8080/api/query/' -H "Authorization: Bearer $JWT" \
  -d '{ "cluster": "alex", "from": 1720879275, "to": 1720964715, "queries": [{"metric": "cpu_load","host": "a0124"}] }'
NATS
As an alternative to the REST API, cc-metric-store can receive metrics via
NATS messaging. See the NATS configuration
for setup details.
Usage of Swagger UI
The Swagger UI is available as part of cc-metric-store if you start it
with the -dev option:
./cc-metric-store -dev
You may access it at http://localhost:8080/swagger/ (adjust port to match your
main.addr configuration).
API Endpoints
The following REST endpoints are available:
| Endpoint | Method | Description |
|---|---|---|
/api/query/ | GET/POST | Query metrics with selectors |
/api/write/ | POST | Write metrics (InfluxDB line protocol) |
/api/free/ | POST | Free buffers up to timestamp |
/api/debug/ | GET | Dump internal state (debugging) |
/api/healthcheck/ | GET | Node health status |
Payload format for write endpoint
The data comes in InfluxDB line protocol format.
<metric>,cluster=<cluster>,hostname=<hostname>,type=<node/hwthread/etc> value=<value> <epoch_time_in_ns_or_s>
Real example:
proc_run,cluster=fritz,hostname=f2163,type=node value=4i 1725620476214474893
A more detailed description of the ClusterCockpit flavored InfluxDB line protocol and their types can be found here in CC specification.
Example script to test endpoint:
# Only use JWT token if the JWT authentication has been setup
JWT="eyJ0eXAiOiJKV1QiLCJhbGciOiJFZERTQSJ9.eyJ1c2VyIjoiYWRtaW4iLCJyb2xlcyI6WyJST0xFX0FETUlOIiwiUk9MRV9BTkFMWVNUIiwiUk9MRV9VU0VSIl19.d-3_3FZTsadPjDEdsWrrQ7nS0edMAR4zjl-eK7rJU3HziNBfI9PDHDIpJVHTNN5E5SlLGLFXctWyKAkwhXL-Dw"

curl -X 'POST' 'http://localhost:8080/api/write/' -H "Authorization: Bearer $JWT" \
  -d "proc_run,cluster=fritz,hostname=f2163,type=node value=4i 1725620476214474893"
Testing with the Metric Generator
For comprehensive testing of the write endpoint, a Metric Generator Script is available. This script simulates high-frequency metric data and supports both REST and NATS transport modes, as well as internal (integrated into cc-backend) and external (standalone) cc-metric-store deployments.
Swagger API Reference
Non-Interactive Documentation
This reference is rendered using theswagger-ui plugin based on the original definition file found in the ClusterCockpit
repository,
but without a serving backend.This means that all interactivity (“Try It Out”) will not return actual data.
However, a Curl call and a compiled Request URL will still be displayed, if
an API endpoint is executed.7.3 - cc-metric-collector
Reference information regarding the ClusterCockpit component “cc-metric-collector” (GitHub Repo).
Overview
cc-metric-collector is a node agent for measuring, processing and forwarding node level metrics. It is part of the ClusterCockpit ecosystem.
The metric collector sends (and receives) metrics in the InfluxDB line protocol as it provides flexibility while providing a separation between tags (like index columns in relational databases) and fields (like data columns).
Key Features
- Modular Architecture: Flexible plugin-based system with collectors, sinks, receivers, and router
- Multiple Data Sources: Collect metrics from various sources (procfs, sysfs, hardware libraries, custom commands)
- Flexible Output: Send metrics to multiple sinks simultaneously (InfluxDB, Prometheus, NATS, etc.)
- On-the-fly Processing: Router can tag, filter, aggregate, and transform metrics before forwarding
- Network Receiver: Accept metrics from other collectors to create hierarchical setups
- Low Overhead: Efficient serial collection with single timestamp per interval
Architecture
There is a single timer loop that triggers all collectors serially, collects the data and sends the metrics to the configured sinks. This ensures all data is submitted with a single timestamp. The sinks currently use mostly blocking APIs.
The receiver runs as a go routine side-by-side with the timer loop and asynchronously forwards received metrics to the sink.
flowchart LR
  subgraph col ["Collectors"]
  direction TB
  cpustat["cpustat"]
  memstat["memstat"]
  tempstat["tempstat"]
  misc["..."]
  end

  subgraph Receivers ["Receivers"]
  direction TB
  nats["NATS"]
  httprecv["HTTP"]
  miscrecv[...]
  end

  subgraph calc["Aggregator"]
  direction LR
  cache["Cache"]
  agg["Calculator"]
  end

  subgraph sinks ["Sinks"]
  direction RL
  influx["InfluxDB"]
  ganglia["Ganglia"]
  logger["Logfile"]
  miscsink["..."]
  end

  cpustat --> CollectorManager["CollectorManager"]
  memstat --> CollectorManager
  tempstat --> CollectorManager
  misc --> CollectorManager

  nats  --> ReceiverManager["ReceiverManager"]
  httprecv --> ReceiverManager
  miscrecv --> ReceiverManager

  CollectorManager --> newrouter["Router"]
  ReceiverManager -.-> newrouter
  calc -.-> newrouter
  newrouter --> SinkManager["SinkManager"]
  newrouter -.-> calc

  SinkManager --> influx
  SinkManager --> ganglia
  SinkManager --> logger
  SinkManager --> miscsink
Components
- Collectors: Read data from local system sources (files, commands, libraries) and send to router
- Router: Process metrics by caching, filtering, tagging, renaming, and aggregating
- Sinks: Send metrics to storage backends (InfluxDB, Prometheus, NATS, etc.)
- Receivers: Accept metrics from other collectors via network (HTTP, NATS) and forward to router
The key difference between collectors and receivers is that collectors are called periodically while receivers run continuously and submit metrics at any time.
Supported Metrics
Supported metrics are documented in the cc-specifications.
Deployment Scenarios
The metric collector was designed with flexibility in mind, so it can be used in many scenarios:
Direct to Database
flowchart TD
  subgraph a ["Cluster A"]
  nodeA[NodeA with CC collector]
  nodeB[NodeB with CC collector]
  nodeC[NodeC with CC collector]
  end
  a --> db[(Database)]
  db <--> ccweb("Webfrontend")
Hierarchical Collection
flowchart TD
  subgraph a [ClusterA]
  direction LR
  nodeA[NodeA with CC collector]
  nodeB[NodeB with CC collector]
  nodeC[NodeC with CC collector]
  end
  subgraph b [ClusterB]
  direction LR
  nodeD[NodeD with CC collector]
  nodeE[NodeE with CC collector]
  nodeF[NodeF with CC collector]
  end
  a --> ccrecv{"CC collector as receiver"}
  b --> ccrecv
  ccrecv --> db[("Database1")]
  ccrecv -.-> db2[("Database2")]
  db <-.-> ccweb("Webfrontend")
Links
- GitHub Repository: ClusterCockpit/cc-metric-collector
- cc-backend: ClusterCockpit/cc-backend
- cc-lib: ClusterCockpit/cc-lib
- DOI: 10.5281/zenodo.7438287
7.3.1 - Configuration
Configuration Overview
The configuration of cc-metric-collector consists of five configuration files: one global file and four component-related files.
Configuration is implemented using a single JSON document that can be distributed over the network and persisted as a file.
Global Configuration File
The global file contains paths to the other four component files and some global options.
Default location: /etc/cc-metric-collector/config.json (can be overridden with -config flag)
Example
{
  "sinks-file": "/etc/cc-metric-collector/sinks.json",
  "collectors-file": "/etc/cc-metric-collector/collectors.json",
  "receivers-file": "/etc/cc-metric-collector/receivers.json",
  "router-file": "/etc/cc-metric-collector/router.json",
  "main": {
    "interval": "10s",
    "duration": "1s"
  }
}
Note: Paths are relative to the execution folder of the cc-metric-collector binary, so it is recommended to use absolute paths.
Configuration Reference
| Config Key | Type | Default | Description |
|---|---|---|---|
sinks-file | string | - | Path to sinks configuration file (relative or absolute) |
collectors-file | string | - | Path to collectors configuration file (relative or absolute) |
receivers-file | string | - | Path to receivers configuration file (relative or absolute) |
router-file | string | - | Path to router configuration file (relative or absolute) |
main.interval | string | 10s | How often metrics should be read and sent to sinks. Parsed using time.ParseDuration() |
main.duration | string | 1s | How long one measurement should take. Important for collectors like likwid that measure over time. |
Alternative Configuration Format
Instead of separate files, you can embed component configurations directly:
{
  "sinks": {
    "mysink": {
      "type": "influxasync",
      "host": "localhost",
      "port": "8086"
    }
  },
  "collectors": {
    "cpustat": {}
  },
  "receivers": {},
  "router": {
    "interval_timestamp": false
  },
  "main": {
    "interval": "10s",
    "duration": "1s"
  }
}
Component Configuration Files
Collectors Configuration
The collectors configuration file specifies which metrics should be queried from the system. See Collectors for available collectors and their configuration options.
Format: Unlike sinks and receivers, the collectors configuration is a set of objects (not a list).
File: collectors.json
Example:
{
  "cpustat": {},
  "memstat": {},
  "diskstat": {
    "exclude_metrics": [
      "disk_total"
    ]
  },
  "likwid": {
    "access_mode": "direct",
    "liblikwid_path": "/usr/local/lib/liblikwid.so",
    "eventsets": [
      {
        "events": {
          "cpu": ["FLOPS_DP"]
        }
      }
    ]
  }
}
Common Options (available for most collectors):
| Option | Type | Description |
|---|---|---|
exclude_metrics | []string | List of metric names to exclude from forwarding to sinks |
send_meta | bool | Send metadata information along with metrics (default varies) |
See: Collectors Documentation for collector-specific configuration options.
Note: Some collectors dynamically load shared libraries. Ensure the library path is part of the LD_LIBRARY_PATH environment variable.
Sinks Configuration
The sinks configuration file defines where metrics should be sent. Multiple sinks of the same or different types can be configured.
Format: Object with named sink configurations
File: sinks.json
Example:
{
  "local_influx": {
    "type": "influxasync",
    "host": "localhost",
    "port": "8086",
    "organization": "myorg",
    "database": "metrics",
    "password": "mytoken"
  },
  "central_prometheus": {
    "type": "prometheus",
    "host": "0.0.0.0",
    "port": "9091"
  },
  "debug_log": {
    "type": "stdout"
  }
}
Common Sink Types:
| Type | Description |
|---|---|
influxasync | InfluxDB v2 asynchronous writer |
influxdb | InfluxDB v2 synchronous writer |
prometheus | Prometheus Pushgateway |
nats | NATS messaging system |
stdout | Standard output (for debugging) |
libganglia | Ganglia monitoring system |
http | Generic HTTP endpoint |
See: cc-lib Sinks Documentation for sink-specific configuration options.
Note: Some sinks dynamically load shared libraries. Ensure the library path is part of the LD_LIBRARY_PATH environment variable.
Router Configuration
The router sits between collectors/receivers and sinks, enabling metric processing such as tagging, filtering, renaming, and aggregation.
File: router.json
Simple Example:
{
  "add_tags": [
    {
      "key": "cluster",
      "value": "mycluster",
      "if": "*"
    }
  ],
  "interval_timestamp": false,
  "num_cache_intervals": 0
}
Advanced Example:
{
  "num_cache_intervals": 1,
  "interval_timestamp": true,
  "hostname_tag": "hostname",
  "max_forward": 50,
  "process_messages": {
    "manipulate_messages": [
      {
        "add_base_tags": {
          "cluster": "mycluster"
        }
      }
    ]
  }
}
Configuration Reference:
| Option | Type | Default | Description |
|---|---|---|---|
interval_timestamp | bool | false | Use common timestamp (interval start) for all metrics in an interval |
num_cache_intervals | int | 0 | Number of past intervals to cache (0 disables cache, required for interval aggregates) |
hostname_tag | string | "hostname" | Tag name for hostname (added to locally created metrics) |
max_forward | int | 50 | Max metrics to read from a channel at once (must be > 1) |
process_messages | object | - | Message processor configuration (see below) |
See: Router Documentation for detailed configuration options and Message Processor for advanced processing.
Receivers Configuration
Receivers enable cc-metric-collector to accept metrics from other collectors via network protocols. For most standalone setups, this file can contain only an empty JSON map ({}).
File: receivers.json
Example:
{
  "nats_rack0": {
    "type": "nats",
    "address": "nats-server.example.org",
    "port": "4222",
    "subject": "rack0"
  },
  "http_receiver": {
    "type": "http",
    "address": "0.0.0.0",
    "port": "8080",
    "path": "/api/write"
  }
}
Common Receiver Types:
| Type | Description |
|---|---|
nats | NATS subscriber |
http | HTTP server endpoint for metric ingestion |
See: cc-lib Receivers Documentation for receiver-specific configuration options.
Configuration Examples
Complete example configurations can be found in the example-configs directory of the repository.
Configuration Validation
To validate your configuration before running the collector:
# Test configuration loading
cc-metric-collector -config /path/to/config.json -once
The -once flag runs all collectors only once and exits, useful for testing.
7.3.2 - Installation
Building from Source
Prerequisites
- Go 1.16 or higher
- Git
- Make
- Standard build tools (gcc, etc.)
Basic Build
In most cases, a simple make in the main folder is enough to get a cc-metric-collector binary:
git clone https://github.com/ClusterCockpit/cc-metric-collector.git
cd cc-metric-collector
make
The build process automatically:
- Downloads dependencies via
go get - Checks for LIKWID library (for LIKWID collector)
- Downloads and builds LIKWID as a static library if not found
- Copies required header files for cgo bindings
Build Output
After successful build, you’ll have:
cc-metric-collectorbinary in the project root- LIKWID library and headers (if LIKWID collector was built)
System Integration
Configuration Files
Create a directory for configuration files:
sudo mkdir -p /etc/cc-metric-collector
sudo cp example-configs/*.json /etc/cc-metric-collector/
Edit the configuration files according to your needs. See Configuration for details.
User and Group Setup
It’s recommended to run cc-metric-collector as a dedicated user:
sudo useradd -r -s /bin/false cc-metric-collector
sudo mkdir -p /var/log/cc-metric-collector
sudo chown cc-metric-collector:cc-metric-collector /var/log/cc-metric-collector
Pre-configuration
The main configuration settings for system integration are pre-defined in scripts/cc-metric-collector.config. This file contains:
- UNIX user and group for execution
- PID file location
- Other system settings
Adjust and install it:
# Edit the configuration
editor scripts/cc-metric-collector.config

# Install to system location
sudo install --mode 644 \
             --owner root \
             --group root \
             scripts/cc-metric-collector.config /etc/default/cc-metric-collector
Systemd Integration
If you are using systemd as your init system:
# Install the systemd service file
sudo install --mode 644 \
             --owner root \
             --group root \
             scripts/cc-metric-collector.service /etc/systemd/system/cc-metric-collector.service

# Reload systemd daemon
sudo systemctl daemon-reload

# Enable the service to start on boot
sudo systemctl enable cc-metric-collector

# Start the service
sudo systemctl start cc-metric-collector

# Check status
sudo systemctl status cc-metric-collector
SysVinit Integration
If you are using an init system based on /etc/init.d daemons:
# Install the init script
sudo install --mode 755 \
             --owner root \
             --group root \
             scripts/cc-metric-collector.init /etc/init.d/cc-metric-collector

# Enable the service
sudo update-rc.d cc-metric-collector defaults

# Start the service
sudo /etc/init.d/cc-metric-collector start
The init script reads basic configuration from /etc/default/cc-metric-collector.
Package Installation
RPM Packages
To build RPM packages:
make RPM
Requirements:
- RPM tools (
rpmandrpmspec) - Git
The command uses the RPM SPEC file scripts/cc-metric-collector.spec and creates packages in the project directory.
Install the generated RPM:
sudo rpm -ivh cc-metric-collector-*.rpm
DEB Packages
To build Debian packages:
make DEB
Requirements:
dpkg-debawk,sed- Git
The command uses the DEB control file scripts/cc-metric-collector.control and creates a binary deb package.
Install the generated DEB:
sudo dpkg -i cc-metric-collector_*.deb
Note: DEB package creation is experimental and not as well tested as RPM packages.
Customizing Packages
To customize RPM or DEB packages for your local system:
- Fork the cc-metric-collector repository
- Enable GitHub Actions in your fork
- Make changes to scripts, code, etc.
- Commit and push your changes
- Tag the commit:
git tag v0.x.y-myversion - Push tags:
git push --tags - Wait for the Release action to complete
- Download RPMs/DEBs from the Releases page of your fork
Library Dependencies
LIKWID Collector
The LIKWID collector requires the LIKWID library. There is currently no Golang interface to LIKWID, so cgo is used to create bindings.
The build process handles LIKWID automatically:
- Checks if LIKWID is installed system-wide
- If not found, downloads and builds LIKWID with
directaccess mode - Copies necessary header files
To use a pre-installed LIKWID:
export LD_LIBRARY_PATH=/path/to/likwid/lib:$LD_LIBRARY_PATH
Other Dynamic Libraries
Some collectors and sinks dynamically load shared libraries:
| Component | Library | Purpose |
|---|---|---|
| LIKWID collector | liblikwid.so | Hardware performance data |
| NVIDIA collector | libnvidia-ml.so | NVIDIA GPU metrics |
| ROCm collector | librocm_smi64.so | AMD GPU metrics |
| Ganglia sink | libganglia.so | Ganglia metric submission |
Ensure required libraries are in your LD_LIBRARY_PATH:
export LD_LIBRARY_PATH=/usr/local/lib:$LD_LIBRARY_PATH
Permissions
Hardware Access
Some collectors require special permissions:
| Collector | Requirement | Solution |
|---|---|---|
| LIKWID (direct) | Direct hardware access | Run as root or use capabilities |
| IPMI | Access to IPMI devices | User must be in ipmi group |
| Temperature | Access to /sys/class/hwmon | Usually readable by all users |
| GPU collectors | Access to GPU management libraries | User must have GPU access rights |
Setting Capabilities (Alternative to Root)
For LIKWID direct access without running as root:
sudo setcap cap_sys_rawio=ep /path/to/cc-metric-collector
Warning: Direct hardware access can be dangerous if misconfigured. Use with caution.
Verification
After installation, verify the collector is working:
# Test configuration
cc-metric-collector -config /etc/cc-metric-collector/config.json -once

# Check logs
journalctl -u cc-metric-collector -f

# Or for SysV
tail -f /var/log/cc-metric-collector/collector.log
Troubleshooting
Common Issues
Issue: cannot find liblikwid.so
- Solution: Set
LD_LIBRARY_PATHor configure in systemd service file
Issue: permission denied accessing hardware
- Solution: Run as root, use capabilities, or adjust file permissions
Issue: Configuration file not found
- Solution: Use
-configflag or place config.json in execution directory
Issue: Metrics not appearing in sink
- Solution: Check sink configuration, network connectivity, and router settings
Debug Mode
Run in foreground with debug output:
cc-metric-collector -config /path/to/config.json -log stderr
Run collectors only once for testing:
cc-metric-collector -config /path/to/config.json -once
7.3.3 - Usage
Command Line Interface
Basic Usage
cc-metric-collector [options]
Command Line Options
| Flag | Type | Default | Description |
|---|---|---|---|
-config | string | ./config.json | Path to configuration file |
-log | string | stderr | Path for logfile (use stderr for console) |
-once | bool | false | Run all collectors only once then exit |
Examples
Run with default configuration:
cc-metric-collector
Run with custom configuration:
cc-metric-collector -config /etc/cc-metric-collector/config.json
Log to file:
cc-metric-collector -config /etc/cc-metric-collector/config.json \
                    -log /var/log/cc-metric-collector/collector.log
Test configuration (run once):
cc-metric-collector -config /etc/cc-metric-collector/config.json -once
This runs all collectors exactly once and exits. Useful for:
- Testing configuration
- Debugging collector issues
- Validating metric output
- One-time metric collection
Running as a Service
Systemd
Start service:
sudo systemctl start cc-metric-collector
Stop service:
sudo systemctl stop cc-metric-collector
Restart service:
sudo systemctl restart cc-metric-collector
Check status:
sudo systemctl status cc-metric-collector
View logs:
journalctl -u cc-metric-collector -f
Enable on boot:
sudo systemctl enable cc-metric-collector
SysVinit
Start service:
sudo /etc/init.d/cc-metric-collector start
Stop service:
sudo /etc/init.d/cc-metric-collector stop
Restart service:
sudo /etc/init.d/cc-metric-collector restart
Check status:
sudo /etc/init.d/cc-metric-collector status
Operation Modes
Daemon Mode (Default)
In daemon mode, cc-metric-collector runs continuously with a timer loop that:
- Triggers all enabled collectors serially
- Collects metrics with a single timestamp per interval
- Forwards metrics through the router
- Sends processed metrics to all configured sinks
- Sleeps until the next interval
Interval timing is controlled by the main.interval configuration parameter.
One-Shot Mode
Activated with the -once flag, this mode:
- Initializes all collectors
- Runs each collector exactly once
- Processes and forwards metrics
- Exits
Useful for:
- Configuration testing
- Debugging
- Cron-based metric collection
- Integration with other monitoring tools
Metric Collection Flow
sequenceDiagram
    participant Timer
    participant Collectors
    participant Router
    participant Sinks

    Timer->>Collectors: Trigger (every interval)
    Collectors->>Collectors: Read metrics from system
    Collectors->>Router: Forward metrics
    Router->>Router: Process (tag, filter, aggregate)
    Router->>Sinks: Send processed metrics
    Sinks->>Sinks: Write to backends
    Timer->>Timer: Sleep until next interval
Common Usage Patterns
Basic Monitoring Setup
Collect basic system metrics and send to InfluxDB:
config.json:
{
  "collectors-file": "./collectors.json",
  "sinks-file": "./sinks.json",
  "receivers-file": "./receivers.json",
  "router-file": "./router.json",
  "main": {
    "interval": "10s",
    "duration": "1s"
  }
}
collectors.json:
{
  "cpustat": {},
  "memstat": {},
  "diskstat": {},
  "netstat": {},
  "loadavg": {}
}
sinks.json:
{
  "influx": {
    "type": "influxasync",
    "host": "influx.example.org",
    "port": "8086",
    "organization": "myorg",
    "database": "metrics",
    "password": "mytoken"
  }
}
router.json:
{
  "add_tags": [
    {
      "key": "cluster",
      "value": "production",
      "if": "*"
    }
  ],
  "interval_timestamp": true
}
receivers.json:
{}
HPC Node Monitoring
Extended monitoring for HPC compute nodes:
collectors.json:
{
  "cpustat": {},
  "memstat": {},
  "diskstat": {},
  "netstat": {},
  "loadavg": {},
  "tempstat": {},
  "likwid": {
    "access_mode": "direct",
    "liblikwid_path": "/usr/local/lib/liblikwid.so",
    "eventsets": [
      {
        "events": {
          "cpu": ["FLOPS_DP", "CLOCK"]
        }
      }
    ]
  },
  "nvidia": {},
  "ibstat": {}
}
Hierarchical Collection
Compute nodes send to aggregation node:
Node config - sinks.json:
{
  "nats_aggregator": {
    "type": "nats",
    "host": "aggregator.example.org",
    "port": "4222",
    "subject": "cluster.rack1"
  }
}
Aggregation node config - receivers.json:
{
  "nats_rack1": {
    "type": "nats",
    "address": "localhost",
    "port": "4222",
    "subject": "cluster.rack1"
  },
  "nats_rack2": {
    "type": "nats",
    "address": "localhost",
    "port": "4222",
    "subject": "cluster.rack2"
  }
}
Aggregation node config - sinks.json:
{
  "influx": {
    "type": "influxasync",
    "host": "influx.example.org",
    "port": "8086",
    "organization": "myorg",
    "database": "metrics",
    "password": "mytoken"
  }
}
Multi-Sink Configuration
Send metrics to multiple destinations:
sinks.json:
{
  "primary_influx": {
    "type": "influxasync",
    "host": "influx1.example.org",
    "port": "8086",
    "organization": "myorg",
    "database": "metrics",
    "password": "token1"
  },
  "backup_influx": {
    "type": "influxasync",
    "host": "influx2.example.org",
    "port": "8086",
    "organization": "myorg",
    "database": "metrics",
    "password": "token2"
  },
  "prometheus": {
    "type": "prometheus",
    "host": "0.0.0.0",
    "port": "9091"
  }
}
Monitoring and Debugging
Check Collector Status
Use -once mode to test without running continuously:
cc-metric-collector -config /etc/cc-metric-collector/config.json -once
Debug Output
Log to stderr for immediate feedback:
cc-metric-collector -config /etc/cc-metric-collector/config.json -log stderr
Verify Metrics
Check what metrics are being collected:
- Configure stdout sink temporarily
- Run in
-oncemode - Observe metric output
Temporary debug sink:
{
  "debug": {
    "type": "stdout"
  }
}
Common Issues
No metrics appearing:
- Check collector configuration
- Verify collectors have required permissions
- Ensure sinks are reachable
- Check router isn’t filtering metrics
High CPU usage:
- Increase
main.intervalvalue - Disable expensive collectors
- Check for router performance issues
Memory growth:
- Reduce
num_cache_intervalsin router - Check for sink write failures
- Verify metric cardinality isn’t excessive
Performance Tuning
Interval Adjustment
Faster updates (more overhead):
{
  "main": {
    "interval": "5s",
    "duration": "1s"
  }
}
Slower updates (less overhead):
{
  "main": {
    "interval": "60s",
    "duration": "1s"
  }
}
Collector Selection
Only enable collectors you need:
{
"cpustat": {},
"memstat": {}
}
Metric Filtering
Use router to exclude unwanted metrics:
{
"process_messages": {
"manipulate_messages": [
{
"drop_by_name": ["cpu_idle", "cpu_iowait"]
}
]
}
}
Security Considerations
Running as Non-Root
Most collectors work without root privileges, except:
- LIKWID (direct mode)
- IPMI collector
- Some hardware-specific collectors
Use capabilities instead of root when possible.
Network Security
When using receivers:
- Use authentication (NATS credentials, HTTP tokens)
- Restrict listening addresses
- Use TLS for encrypted transport
- Firewall receiver ports appropriately
File Permissions
Protect configuration files containing credentials:
sudo chmod 600 /etc/cc-metric-collector/config.json
sudo chown cc-metric-collector:cc-metric-collector /etc/cc-metric-collector/config.json
7.3.4 - Metric Router
Overview
The metric router sits between collectors/receivers and sinks, enabling metric processing such as:
- Adding and removing tags
- Filtering and dropping metrics
- Renaming metrics
- Aggregating metrics across an interval
- Normalizing units
- Setting common timestamps
Basic Configuration
File: router.json
Minimal configuration:
{
"interval_timestamp": false,
"num_cache_intervals": 0
}
Typical configuration:
{
"add_tags": [
{
"key": "cluster",
"value": "mycluster",
"if": "*"
}
],
"interval_timestamp": true,
"num_cache_intervals": 0
}
Configuration Options
Core Settings
| Option | Type | Default | Description |
|---|---|---|---|
interval_timestamp | bool | false | Use common timestamp (interval start) for all metrics in an interval |
num_cache_intervals | int | 0 | Number of past intervals to cache (0 disables cache, required for interval aggregates) |
hostname_tag | string | "hostname" | Tag name for hostname (added to locally created metrics) |
max_forward | int | 50 | Max metrics to read from a channel at once (must be > 1) |
The interval_timestamp Option
Collectors’ Read() functions are not called simultaneously, so metrics within an interval can have different timestamps.
When true: All metrics in an interval get a common timestamp (the interval start time)
When false: Each metric keeps its original collection timestamp
Use case: Enable this to simplify time-series alignment in your database.
The num_cache_intervals Option
Controls metric caching for interval aggregations.
| Value | Behavior |
|---|---|
0 | Cache disabled (no aggregations possible) |
1 | Cache last interval only (minimal memory, basic aggregations) |
2+ | Cache multiple intervals (for complex time-based aggregations) |
Note: Required to be > 0 for interval_aggregates to work.
The hostname_tag Option
By default, the router tags locally created metrics with the hostname.
Default tag name: hostname
Custom tag name:
{
"hostname_tag": "node"
}
The max_forward Option
Performance tuning for metric processing.
How it works: When the router receives a metric, it tries to read up to max_forward additional metrics from the same channel before processing.
Default: 50
Must be: Greater than 1
Metric Processing
Modern Configuration (Recommended)
Use the process_messages section with the message processor:
{
"process_messages": {
"manipulate_messages": [
{
"add_base_tags": {
"cluster": "mycluster",
"partition": "compute"
}
},
{
"drop_by_name": ["cpu_idle", "mem_cached"]
},
{
"rename_by": {
"clock_mhz": "clock"
}
}
]
}
}
Legacy Configuration (Deprecated)
The following options are deprecated but still supported for backward compatibility. They are automatically converted to process_messages format.
Adding Tags
Deprecated syntax:
{
"add_tags": [
{
"key": "cluster",
"value": "mycluster",
"if": "*"
},
{
"key": "type",
"value": "socket",
"if": "name == 'temp_package_id_0'"
}
]
}
Modern equivalent:
{
"process_messages": {
"manipulate_messages": [
{
"add_base_tags": {
"cluster": "mycluster"
}
},
{
"add_tags_by": {
"type": "socket"
},
"if": "name == 'temp_package_id_0'"
}
]
}
}
Deleting Tags
Deprecated syntax:
{
"delete_tags": [
{
"key": "unit",
"if": "*"
}
]
}
Never delete these tags: hostname, type, type-id
Dropping Metrics
By name (deprecated):
{
"drop_metrics": [
"not_interesting_metric",
"debug_metric"
]
}
By condition (deprecated):
{
"drop_metrics_if": [
"match('temp_core_%d+', name)",
"match('cpu', type) && type-id == 0"
]
}
Modern equivalent:
{
"process_messages": {
"manipulate_messages": [
{
"drop_by_name": ["not_interesting_metric", "debug_metric"]
},
{
"drop_by": "match('temp_core_%d+', name)"
}
]
}
}
Renaming Metrics
Deprecated syntax:
{
"rename_metrics": {
"old_name": "new_name",
"clock_mhz": "clock"
}
}
Modern equivalent:
{
"process_messages": {
"manipulate_messages": [
{
"rename_by": {
"old_name": "new_name",
"clock_mhz": "clock"
}
}
]
}
}
Use case: Standardize metric names across different systems or collectors.
Normalizing Units
Deprecated syntax:
{
"normalize_units": true
}
Effect: Normalizes unit names (e.g., byte, Byte, B, bytes → consistent format)
Changing Unit Prefixes
Deprecated syntax:
{
"change_unit_prefix": {
"mem_used": "G",
"mem_total": "G"
}
}
Use case: Convert memory metrics from kB (as reported by /proc/meminfo) to GB for better readability.
Interval Aggregates (Experimental)
Requires: num_cache_intervals > 0
Derive new metrics by aggregating metrics from the current interval.
Configuration
{
"num_cache_intervals": 1,
"interval_aggregates": [
{
"name": "temp_cores_avg",
"if": "match('temp_core_%d+', metric.Name())",
"function": "avg(values)",
"tags": {
"type": "node"
},
"meta": {
"group": "IPMI",
"unit": "degC",
"source": "TempCollector"
}
}
]
}
Parameters
| Field | Type | Description |
|---|---|---|
name | string | Name of the new derived metric |
if | string | Condition to select which metrics to aggregate |
function | string | Aggregation function (e.g., avg(values), sum(values), max(values)) |
tags | object | Tags to add to the derived metric |
meta | object | Metadata for the derived metric (use "<copy>" to copy from source metrics) |
Available Functions
| Function | Description |
|---|---|
avg(values) | Average of all matching metrics |
sum(values) | Sum of all matching metrics |
min(values) | Minimum value |
max(values) | Maximum value |
count(values) | Number of matching metrics |
Complex Example
Calculate mem_used from multiple memory metrics:
{
"interval_aggregates": [
{
"name": "mem_used",
"if": "source == 'MemstatCollector'",
"function": "sum(mem_total) - (sum(mem_free) + sum(mem_buffers) + sum(mem_cached))",
"tags": {
"type": "node"
},
"meta": {
"group": "<copy>",
"unit": "<copy>",
"source": "<copy>"
}
}
]
}
Dropping Source Metrics
If you only want the aggregated metric, drop the source metrics:
{
"drop_metrics_if": [
"match('temp_core_%d+', metric.Name())"
],
"interval_aggregates": [
{
"name": "temp_cores_avg",
"if": "match('temp_core_%d+', metric.Name())",
"function": "avg(values)",
"tags": {
"type": "node"
},
"meta": {
"group": "IPMI",
"unit": "degC"
}
}
]
}
Processing Order
The router processes metrics in a specific order:
- Add
hostname_tag(if sent by collectors or cache) - Change timestamp to interval timestamp (if
interval_timestamp == true) - Check if metric should be dropped (
drop_metrics,drop_metrics_if) - Add tags (
add_tags) - Delete tags (
del_tags) - Rename metric (
rename_metrics) and store old name in meta asoldname - Add tags again (to support conditions using new name)
- Delete tags again (to support conditions using new name)
- Normalize units (if
normalize_units == true) - Convert unit prefix (
change_unit_prefix) - Send to sinks
- Move to cache (if
num_cache_intervals > 0)
Legend:
- Operations apply to metrics from collectors (c)
- Operations apply to metrics from receivers (r)
- Operations apply to both (c,r)
Complete Example
{
"interval_timestamp": true,
"num_cache_intervals": 1,
"hostname_tag": "hostname",
"max_forward": 50,
"process_messages": {
"manipulate_messages": [
{
"add_base_tags": {
"cluster": "production",
"datacenter": "dc1"
}
},
{
"drop_by_name": ["cpu_idle", "cpu_guest", "cpu_guest_nice"]
},
{
"rename_by": {
"clock_mhz": "clock"
}
},
{
"add_tags_by": {
"high_temp": "true"
},
"if": "name == 'temp_package_id_0' && value > 70"
}
]
},
"interval_aggregates": [
{
"name": "temp_avg",
"if": "match('temp_core_%d+', name)",
"function": "avg(values)",
"tags": {
"type": "node"
},
"meta": {
"group": "Temperature",
"unit": "degC",
"source": "TempCollector"
}
}
]
}
Performance Considerations
- Caching: Only enable if you need interval aggregates (memory overhead)
- Complex conditions: Evaluated for every metric (CPU overhead)
- Aggregations: Evaluated at the start of each interval (CPU overhead)
- max_forward: Higher values can improve throughput but increase latency
See Also
7.3.5 - Collectors
Overview
Collectors read data from various sources on the local system, parse it into metrics, and submit these metrics to the router. Each collector is a modular plugin that can be enabled or disabled independently.
Configuration Format
File: collectors.json
The collectors configuration is a set of objects (not a list), where each key is the collector type:
{
"collector_type": {
"collector_specific_option": "value"
}
}
Common Configuration Options
Most collectors support these common options:
| Option | Type | Default | Description |
|---|---|---|---|
exclude_metrics | []string | [] | List of metric names to exclude from forwarding to sinks |
send_meta | bool | varies | Send metadata information along with metrics |
Example:
{
"cpustat": {
"exclude_metrics": ["cpu_idle", "cpu_guest"]
},
"memstat": {}
}
Available Collectors
System Metrics
| Collector | Description | Source |
|---|---|---|
cpustat | CPU usage statistics | /proc/stat |
memstat | Memory usage statistics | /proc/meminfo |
loadavg | System load average | /proc/loadavg |
netstat | Network interface statistics | /proc/net/dev |
diskstat | Disk I/O statistics | /sys/block/*/stat |
iostat | Block device I/O statistics | /proc/diskstats |
Hardware Monitoring
| Collector | Description | Requirements |
|---|---|---|
tempstat | Temperature sensors | /sys/class/hwmon |
cpufreq | CPU frequency | /sys/devices/system |
cpufreq_cpuinfo | CPU frequency from cpuinfo | /proc/cpuinfo |
ipmistat | IPMI sensor data | ipmitool command |
Performance Monitoring
| Collector | Description | Requirements |
|---|---|---|
likwid | Hardware performance counters via LIKWID | liblikwid.so |
rapl | CPU energy consumption (RAPL) | /sys/class/powercap |
schedstat | CPU scheduler statistics | /proc/schedstat |
numastats | NUMA node statistics | /sys/devices/system/node |
GPU Monitoring
| Collector | Description | Requirements |
|---|---|---|
nvidia | NVIDIA GPU metrics | libnvidia-ml.so (NVML) |
rocm_smi | AMD ROCm GPU metrics | librocm_smi64.so |
Network & Storage
| Collector | Description | Requirements |
|---|---|---|
ibstat | InfiniBand statistics | /sys/class/infiniband |
lustrestat | Lustre filesystem statistics | Lustre client |
gpfs | GPFS filesystem statistics | GPFS utilities |
beegfs_meta | BeeGFS metadata statistics | BeeGFS metadata client |
beegfs_storage | BeeGFS storage statistics | BeeGFS storage client |
nfs3stat | NFS v3 statistics | /proc/net/rpc/nfs |
nfs4stat | NFS v4 statistics | /proc/net/rpc/nfs |
nfsiostat | NFS I/O statistics | nfsiostat command |
Process & Job Monitoring
| Collector | Description | Requirements |
|---|---|---|
topprocs | Top processes by resource usage | /proc filesystem |
slurm_cgroup | Slurm cgroup statistics | Slurm cgroups |
self | Collector’s own resource usage | /proc/self |
Custom Collectors
| Collector | Description | Requirements |
|---|---|---|
customcmd | Execute custom commands to collect metrics | Any command/script |
Collector Lifecycle
Each collector implements these functions:
Init(config): Initializes the collector with configurationInitialized(): Returns whether initialization was successfulRead(duration, output): Reads metrics and sends to output channelClose(): Cleanup and shutdown
Example Configurations
Minimal System Monitoring
{
"cpustat": {},
"memstat": {},
"loadavg": {}
}
HPC Node Monitoring
{
"cpustat": {},
"memstat": {},
"diskstat": {},
"netstat": {},
"loadavg": {},
"tempstat": {},
"likwid": {
"access_mode": "direct",
"liblikwid_path": "/usr/local/lib/liblikwid.so",
"eventsets": [
{
"events": {
"cpu": ["FLOPS_DP", "CLOCK"]
}
}
]
},
"nvidia": {},
"ibstat": {}
}
Filesystem-Heavy Workload
{
"cpustat": {},
"memstat": {},
"diskstat": {},
"lustrestat": {},
"nfs4stat": {},
"iostat": {}
}
Minimal Overhead
{
"cpustat": {
"exclude_metrics": ["cpu_guest", "cpu_guest_nice", "cpu_steal"]
},
"memstat": {
"exclude_metrics": ["mem_slab", "mem_sreclaimable"]
}
}
Collector Development
Creating a Custom Collector
Collectors implement the MetricCollector interface. See collectors README for details.
Basic structure:
type SampleCollector struct {
metricCollector
config SampleCollectorConfig
}
func (m *SampleCollector) Init(config json.RawMessage) error
func (m *SampleCollector) Read(interval time.Duration, output chan lp.CCMetric)
func (m *SampleCollector) Close()
Registration
Add your collector to collectorManager.go:
var AvailableCollectors = map[string]MetricCollector{
"sample": &SampleCollector{},
}
Metric Format
All collectors submit metrics in InfluxDB line protocol format via the CCMetric type.
Metric components:
- Name: Metric identifier (e.g.,
cpu_used) - Tags: Index-like key-value pairs (e.g.,
type=node,hostname=node01) - Fields: Data values (typically just
value) - Metadata: Source, group, unit information
- Timestamp: When the metric was collected
Performance Considerations
- Collector overhead: Each enabled collector adds CPU overhead
- I/O impact: Some collectors read many files (e.g., per-core statistics)
- Library overhead: GPU and hardware performance collectors can be expensive
- Selective metrics: Use
exclude_metricsto reduce unnecessary data
See Also
7.4 - cc-slurm-adapter
Reference information regarding the ClusterCockpit component “cc-slurm-adapter” (GitHub Repo).
Overview
cc-slurm-adapter is a software daemon that feeds cc-backend with job information from Slurm in realtime.
Key Features
- Fault Tolerant: Handles cc-backend or Slurm downtime gracefully without losing jobs
- Automatic Recovery: Submits jobs to cc-backend as soon as services are available again
- Realtime Updates: Supports immediate job notification via Slurm Prolog/Epilog hooks
- NATS Integration: Optional job notification messaging via NATS
- Minimal Dependencies: Uses Slurm commands (
sacct,squeue,sacctmgr,scontrol) - noslurmrestdrequired
Architecture
The daemon runs on the same node as slurmctld and operates in two modes:
- Daemon Mode: Periodic synchronization (default: every 60 seconds) between Slurm and cc-backend
- Prolog/Epilog Mode: Immediate trigger on job start/stop events (optional, reduces latency)
Data is submitted to cc-backend via REST API. Note: Slurm’s slurmdbd is mandatory.
Notice
You can set the Slurm option MinJobAge to prolong the duration Slurm will hold Job infos in memory.Limitations
Resource Information Availability
Because slurmdbd does not store all job information, some details may be unavailable in certain cases:
- Resource allocation information is obtained via
scontrol --cluster XYZ show job XYZ --json - This information becomes unavailable a few minutes after job completion
- If the daemon is stopped for too long, jobs may lack resource information
- Critical Impact: Without resource information, cc-backend cannot associate jobs with metrics (CPU, GPU, memory)
- Jobs will still be listed in cc-backend but metric visualization will not work
Slurm Version Compatibility
Supported Versions
These Slurm versions are known to work:
- 24.xx.x
- 25.xx.x
Compatibility Notes
All Slurm-related code is concentrated in slurm.go for easier maintenance. The
most common compatibility issue is nil pointer dereference due to missing
JSON fields.
Debugging Incompatibilities
If you encounter nil pointer dereferences:
Get a job ID via
squeueorsacctCheck JSON layouts from both commands (they differ):
sacct -j 12345 --json scontrol show job 12345 --json
SlurmInt and SlurmString Types
Slurm has been transitioning API formats:
- SlurmInt: Handles both plain integers and Slurm’s “infinite/set” struct format
- SlurmString: Handles both plain strings and string arrays (uses first element if array, blank if empty)
These custom types maintain backward compatibility across Slurm versions.
Links
- GitHub Repository: ClusterCockpit/cc-slurm-adapter
- cc-backend: ClusterCockpit/cc-backend
- Slurm Documentation: https://slurm.schedmd.com/
- NATS: https://nats.io/
7.4.1 - Installation
Prerequisites
- Go 1.24.0 or higher
- Slurm with slurmdbd configured
- cc-backend instance with API access
- Access to the slurmctld node
Building from Source
Requirements
go 1.24.0+
Dependencies
Key dependencies (managed via go.mod):
github.com/ClusterCockpit/cc-lib- ClusterCockpit common librarygithub.com/nats-io/nats.go- NATS client
Compilation
make
This creates the cc-slurm-adapter binary.
Build Commands
# Build binary
make
# Format code
make format
# Clean build artifacts
make clean
7.4.2 - cc-slurm-adapter Configuration
Configuration File Location
Default: /etc/cc-slurm-adapter/config.json
Example Configuration
{
"pidFilePath": "/run/cc-slurm-adapter/daemon.pid",
"prepSockListenPath": "/run/cc-slurm-adapter/daemon.sock",
"prepSockConnectPath": "/run/cc-slurm-adapter/daemon.sock",
"lastRunPath": "/var/lib/cc-slurm-adapter/last_run",
"slurmPollInterval": 60,
"slurmQueryDelay": 1,
"slurmQueryMaxSpan": 604800,
"slurmQueryMaxRetries": 5,
"ccPollInterval": 21600,
"ccRestSubmitJobs": true,
"ccRestUrl": "https://my-cc-backend-instance.example",
"ccRestJwt": "XXXXXXXXXXXXXXXXXXXXXXXXXXXXXXXXXXXXXXXXXXXXX",
"gpuPciAddrs": {
"^nodehostname0[0-9]$": ["00000000:00:10.0", "00000000:00:3F.0"],
"^nodehostname1[0-9]$": ["00000000:00:10.0", "00000000:00:3F.0"]
},
"ignoreHosts": "^nodehostname9\\w+$",
"natsServer": "mynatsserver.example",
"natsPort": 4222,
"natsSubject": "mysubject",
"natsUser": "myuser",
"natsPassword": "123456789",
"natsCredsFile": "/etc/cc-slurm-adapter/nats.creds",
"natsNKeySeedFile": "/etc/ss-slurm-adapter/nats.nkey"
}
Configuration Reference
Required Settings
| Config Key | Type | Description |
|---|---|---|
ccRestUrl | string | URL to cc-backend’s REST API (must not contain trailing slash) |
ccRestJwt | string | JWT token from cc-backend for REST API access |
Daemon Settings
| Config Key | Type | Default | Description |
|---|---|---|---|
pidFilePath | string | /run/cc-slurm-adapter/daemon.pid | Path to PID file (prevents concurrent execution) |
lastRunPath | string | /var/lib/cc-slurm-adapter/lastrun | Path to file storing last successful sync timestamp (as file mtime) |
Socket Settings
| Config Key | Type | Default | Description |
|---|---|---|---|
prepSockListenPath | string | /run/cc-slurm-adapter/daemon.sock | Socket for daemon to receive prolog/epilog events. Supports UNIX and TCP formats (see below) |
prepSockConnectPath | string | /run/cc-slurm-adapter/daemon.sock | Socket for prolog/epilog mode to connect to daemon |
Socket Formats:
- UNIX:
/run/cc-slurm-adapter/daemon.sockorunix:/run/cc-slurm-adapter/daemon.sock - TCP IPv4:
tcp:127.0.0.1:12345ortcp:0.0.0.0:12345 - TCP IPv6:
tcp:[::1]:12345,tcp:[::]:12345,tcp::12345
Slurm Polling Settings
| Config Key | Type | Default | Description |
|---|---|---|---|
slurmPollInterval | int | 60 | Interval (seconds) for periodic sync to cc-backend |
slurmQueryDelay | int | 1 | Wait time (seconds) after prolog/epilog event before querying Slurm |
slurmQueryMaxSpan | int | 604800 | Maximum time (seconds) to query jobs from the past (prevents flooding) |
slurmQueryMaxRetries | int | 10 | Maximum Slurm query attempts on Prolog/Epilog events |
cc-backend Settings
| Config Key | Type | Default | Description |
|---|---|---|---|
ccPollInterval | int | 21600 | Interval (seconds) to query all jobs from cc-backend (prevents stuck jobs) |
ccRestSubmitJobs | bool | true | Submit started/stopped jobs to cc-backend via REST (set false if using NATS-only) |
Hardware Mapping
| Config Key | Type | Default | Description |
|---|---|---|---|
gpuPciAddrs | object | {} | Map of hostname regexes to GPU PCI address arrays (must match NVML/nvidia-smi order) |
ignoreHosts | string | "" | Regex of hostnames to ignore (jobs only on matching hosts are discarded) |
NATS Settings
| Config Key | Type | Default | Description |
|---|---|---|---|
natsServer | string | "" | NATS server hostname (leave blank to disable NATS) |
natsPort | uint16 | 4222 | NATS server port |
natsSubject | string | "jobs" | Subject to publish job information to |
natsUser | string | "" | NATS username (for user auth) |
natsPassword | string | "" | NATS password |
natsCredsFile | string | "" | Path to NATS credentials file |
natsNKeySeedFile | string | "" | Path to NATS NKey seed file (private key) |
Note: The deprecated ipcSockPath option has been removed. Use prepSockListenPath and prepSockConnectPath instead.
7.4.3 - Daemon Setup
The daemon mode is required for cc-slurm-adapter to function. This page describes how to set up the daemon using systemd.
1. Copy Binary and Configuration
Copy the binary and create a configuration file:
sudo mkdir -p /opt/cc-slurm-adapter
sudo cp cc-slurm-adapter /opt/cc-slurm-adapter/
sudo cp config.json /opt/cc-slurm-adapter/
Security: The config file contains sensitive credentials (JWT, NATS). Set appropriate permissions:
sudo chmod 600 /opt/cc-slurm-adapter/config.json
2. Create System User
sudo useradd -r -s /bin/false cc-slurm-adapter
sudo chown -R cc-slurm-adapter:slurm /opt/cc-slurm-adapter
3. Grant Slurm Permissions
The adapter user needs permission to query Slurm:
sacctmgr add user cc-slurm-adapter Account=root AdminLevel=operator
Critical: If permissions are not set and Slurm is restricted, NO JOBS WILL BE REPORTED.
4. Install systemd Service
Create /etc/systemd/system/cc-slurm-adapter.service:
[Unit]
Description=cc-slurm-adapter
Wants=network.target
After=network.target
[Service]
User=cc-slurm-adapter
Group=slurm
ExecStart=/opt/cc-slurm-adapter/cc-slurm-adapter -daemon -config /opt/cc-slurm-adapter/config.json
WorkingDirectory=/opt/cc-slurm-adapter/
RuntimeDirectory=cc-slurm-adapter
RuntimeDirectoryMode=0750
Restart=on-failure
RestartSec=15s
[Install]
WantedBy=multi-user.target
Notes:
RuntimeDirectorycreates/run/cc-slurm-adapterfor PID and socket filesGroup=slurmallows Prolog/Epilog (running as slurm user) to access the socketRuntimeDirectoryMode=0750enables group access
5. Enable and Start Service
sudo systemctl daemon-reload
sudo systemctl enable cc-slurm-adapter
sudo systemctl start cc-slurm-adapter
Verification
Check that the service is running:
sudo systemctl status cc-slurm-adapter
You should see output indicating the service is active and running.
7.4.4 - Prolog/Epilog Hooks
Prolog/Epilog hook setup is optional but recommended for immediate job notification, which reduces latency compared to relying solely on periodic polling.
Prerequisites
- Daemon must be running (see Daemon Setup)
- Hook script must be accessible from slurmctld
- Hook script must exit with code 0 to avoid rejecting job allocations
1. Create Hook Script
Create /opt/cc-slurm-adapter/hook.sh:
#!/bin/sh
/opt/cc-slurm-adapter/cc-slurm-adapter
exit 0
Make it executable:
sudo chmod +x /opt/cc-slurm-adapter/hook.sh
Important: Always exit with 0. Non-zero exit codes will reject job allocations.
2. Configure Slurm
Add to slurm.conf:
PrEpPlugins=prep/script
PrologSlurmctld=/opt/cc-slurm-adapter/hook.sh
EpilogSlurmctld=/opt/cc-slurm-adapter/hook.sh
3. Restart slurmctld
sudo systemctl restart slurmctld
Note: If using non-default socket path, add -config /path/to/config.json to hook.sh. The config file must be readable by the slurm user/group.
Multi-Cluster Setup
For multiple slurmctld nodes, use TCP sockets instead of UNIX sockets:
{
"prepSockListenPath": "tcp:0.0.0.0:12345",
"prepSockConnectPath": "tcp:slurmctld-host:12345"
}
This allows Prolog/Epilog hooks on different nodes to connect to the daemon over the network.
How It Works
- Job Event: Slurm triggers Prolog/Epilog hook when a job starts or stops
- Socket Message: Hook sends job ID to daemon via socket
- Immediate Query: Daemon queries Slurm for that specific job
- Fast Submission: Job submitted to cc-backend with minimal delay
This reduces the job notification latency from up to 60 seconds (default poll interval) to just a few seconds.
7.4.5 - Usage
Command Line Flags
| Flag | Description |
|---|---|
-config <path> | Specify the path to the config file (default: /etc/cc-slurm-adapter/config.json) |
-daemon | Run in daemon mode (if omitted, runs in Prolog/Epilog mode) |
-debug <log-level> | Set the log level (default: 2, max: 5) |
-help | Show help for all command line flags |
Operation Modes
Daemon Mode
Run the adapter as a persistent daemon that periodically synchronizes job information:
cc-slurm-adapter -daemon -config /path/to/config.json
This mode:
- Runs continuously in the background
- Queries Slurm at regular intervals (default: 60 seconds)
- Submits job information to cc-backend
- Should be managed by systemd (see Daemon Setup)
Prolog/Epilog Mode
Run the adapter from Slurm’s Prolog/Epilog hooks for immediate job notification:
cc-slurm-adapter
This mode:
- Only runs when triggered by Slurm (job start/stop)
- Sends job ID to the running daemon via socket
- Exits immediately
- Must be invoked from Slurm hook scripts (see Prolog/Epilog Setup)
Best Practices
Production Deployment
- Keep Daemon Running: Resource info expires quickly after job completion
- Monitor Logs: Watch for Slurm API changes or nil pointer errors
- Secure Credentials: Restrict config file permissions (600 or 640)
- Use Prolog/Epilog Carefully: Always exit with 0 to avoid blocking job allocations
- Test Before Production: Verify in development environment first
Performance Tuning
- High Job Volume: Reduce
slurmPollIntervalif periodic sync causes lag - Low Latency Required: Enable Prolog/Epilog hooks
- Resource Constrained: Increase
ccPollInterval(reduces cc-backend queries)
Debug Logging
Enable verbose logging for troubleshooting:
cc-slurm-adapter -daemon -debug 5 -config /path/to/config.json
Log Levels:
- 2 (default): Errors and warnings
- 5 (max): Verbose debug output
For systemd services, edit the service file to add -debug 5 to the ExecStart line.
7.4.6 - Troubleshooting
Check Service Status
Verify the daemon is running:
sudo systemctl status cc-slurm-adapter
You should see output indicating the service is active (running).
View Logs
cc-slurm-adapter logs to stderr (captured by systemd):
sudo journalctl -u cc-slurm-adapter -f
Use -f to follow logs in real-time, or omit it to view historical logs.
Enable Debug Logging
Edit the systemd service file to add -debug 5:
ExecStart=/opt/cc-slurm-adapter/cc-slurm-adapter -daemon -debug 5 -config /opt/cc-slurm-adapter/config.json
Then reload and restart:
sudo systemctl daemon-reload
sudo systemctl restart cc-slurm-adapter
Log Levels:
- 2 (default): Errors and warnings
- 5 (max): Verbose debug output
Common Issues
| Issue | Possible Cause | Solution |
|---|---|---|
| No jobs reported | Missing Slurm permissions | Run sacctmgr add user cc-slurm-adapter Account=root AdminLevel=operator |
| Socket connection errors | Wrong socket path or permissions | Check prepSockListenPath/prepSockConnectPath and RuntimeDirectoryMode |
| Prolog/Epilog failures | Non-zero exit code in hook script | Ensure hook script exits with exit 0 |
| Missing resource info | Daemon stopped too long | Keep daemon running; resource info expires minutes after job completion |
| Job allocation failures | Prolog/Epilog exit code ≠ 0 | Check hook script and ensure cc-slurm-adapter is running |
Debugging Slurm Compatibility Issues
If you encounter nil pointer dereferences or unexpected errors:
Get a job ID via
squeueorsacct:squeue # or sacctCheck JSON layouts from both commands (they differ):
sacct -j 12345 --json scontrol show job 12345 --jsonCompare the output with what the adapter expects in
slurm.goReport issues to the GitHub repository with:
- Slurm version
- JSON output samples
- Error messages from logs
Verifying Configuration
Check that your configuration is valid:
# Test if config file is readable
cat /opt/cc-slurm-adapter/config.json
# Verify JSON syntax
jq . /opt/cc-slurm-adapter/config.json
Testing Connectivity
Test cc-backend Connection
# Test REST API endpoint (replace with your JWT)
curl -H "Authorization: Bearer YOUR_JWT_TOKEN" \
https://your-cc-backend-instance.example/api/jobs/
Test NATS Connection
If using NATS, verify connectivity:
# Using nats-cli (if installed)
nats server check -s nats://mynatsserver.example:4222
Performance Issues
If the adapter is slow or missing jobs:
- Check Slurm Response Times: Run
sacctandsqueuemanually to see if Slurm is responding slowly - Adjust Poll Intervals: Lower
slurmPollIntervalfor more frequent checks (but higher load) - Enable Prolog/Epilog: Reduces dependency on polling for immediate job notification
- Check System Resources: Ensure adequate CPU/memory on the slurmctld node
7.4.7 - Architecture
Synchronization Flow
The daemon operates on a periodic synchronization cycle:
- Timer Trigger: Periodic timer (default: 60s) triggers sync
- Query Slurm: Fetch job data via
sacct,squeue,scontrol - Submit to cc-backend: POST job start/stop via REST API
- Publish to NATS: Optional notification message (if enabled)
This ensures that all jobs are eventually captured, even if Prolog/Epilog hooks fail or are not configured.
Prolog/Epilog Flow
When Prolog/Epilog hooks are enabled, immediate job notification works as follows:
- Job Event: Slurm triggers Prolog/Epilog hook when a job starts or stops
- Socket Message: Hook sends job ID to daemon via socket
- Immediate Query: Daemon queries Slurm for that specific job
- Fast Submission: Job submitted to cc-backend with minimal delay
This reduces latency from up to 60 seconds (default poll interval) to just a few seconds.
Data Sources
The adapter queries multiple Slurm commands to build complete job information:
| Slurm Command | Purpose |
|---|---|
sacct | Historical job accounting data |
squeue | Current job queue information |
scontrol show job | Resource allocation details (JSON format) |
sacctmgr | User permissions |
Important: scontrol show job provides critical resource allocation information (nodes, CPUs, GPUs) that is only available while the job is in memory. This information typically expires a few minutes after job completion, which is why keeping the daemon running continuously is essential.
State Persistence
The adapter maintains minimal state on disk:
Last Run Timestamp: Stored as file modification time in
lastRunPath- Used to determine which jobs to query on startup
- Prevents flooding cc-backend with historical jobs after restarts
PID File: Stored in
pidFilePath- Prevents concurrent daemon execution
- Automatically cleaned up on graceful shutdown
Socket: IPC between daemon and Prolog/Epilog instances
- Created at
prepSockListenPath(daemon listens) - Connected at
prepSockConnectPath(Prolog/Epilog connects) - Supports both UNIX domain sockets and TCP sockets
- Created at
Fault Tolerance
The adapter is designed to be fault-tolerant:
Slurm Downtime
- Retries Slurm queries with exponential backoff
- Continues operation once Slurm becomes available
- No job loss during Slurm restarts
cc-backend Downtime
- Queues jobs internally (up to
slurmQueryMaxSpanseconds in the past) - Submits queued jobs once cc-backend is available
- Prevents duplicate submissions
Daemon Restarts
- Uses
lastRunPathtimestamp to catch up on missed jobs - Limited by
slurmQueryMaxSpanto prevent overwhelming the system - Resource allocation data may be lost for jobs that completed while daemon was down
Multi-Cluster Considerations
For environments with multiple Slurm clusters:
- Run one daemon instance per slurmctld node
- Use cluster-specific configuration files
- Consider TCP sockets for Prolog/Epilog if slurmctld is not on compute nodes
Performance Characteristics
Resource Usage
- Memory: Minimal (< 50 MB typical)
- CPU: Low (periodic bursts during synchronization)
- Network: Moderate (REST API calls to cc-backend, NATS if enabled)
Scalability
- Tested with clusters of 1000+ nodes
- Handle thousands of jobs per day
- Poll interval can be tuned based on job submission rate
Latency
- Without Prolog/Epilog: Up to
slurmPollIntervalseconds (default: 60s) - With Prolog/Epilog: Typically < 5 seconds
7.4.8 - API Integration
cc-backend REST API
The adapter communicates with cc-backend using its REST API to submit job information.
Configuration
Set these required configuration options:
{
"ccRestUrl": "https://my-cc-backend-instance.example",
"ccRestJwt": "XXXXXXXXXXXXXXXXXXXXXXXXXXXXXXXXXXXXXXXXXXXXX",
"ccRestSubmitJobs": true
}
- ccRestUrl: URL to cc-backend’s REST API (must not contain trailing slash)
- ccRestJwt: JWT token from cc-backend for REST API access
- ccRestSubmitJobs: Enable/disable REST API submissions (default: true)
Endpoints Used
The adapter uses the following cc-backend API endpoints:
| Endpoint | Method | Purpose |
|---|---|---|
/api/jobs/start_job/ | POST | Submit job start event |
/api/jobs/stop_job/<jobId> | POST | Submit job completion event |
Authentication
All API requests include a JWT bearer token in the Authorization header:
Authorization: Bearer <ccRestJwt>
Job Data Format
Jobs are submitted in ClusterCockpit’s job metadata format, including:
- Job ID and cluster name
- User and project information
- Start and stop times
- Resource allocation (nodes, CPUs, GPUs)
- Job state and exit code
Error Handling
- Connection Errors: Adapter retries with exponential backoff
- Authentication Errors: Logged as errors; check JWT token validity
- Validation Errors: Logged with details about invalid fields
NATS Messaging
NATS integration is optional and provides real-time job notifications to other services.
Configuration
{
"natsServer": "mynatsserver.example",
"natsPort": 4222,
"natsSubject": "mysubject",
"natsUser": "myuser",
"natsPassword": "123456789"
}
Leave natsServer empty to disable NATS integration.
Authentication Methods
The adapter supports multiple NATS authentication methods:
1. Username/Password
{
"natsUser": "myuser",
"natsPassword": "mypassword"
}
See: NATS Username/Password Auth
2. Credentials File
{
"natsCredsFile": "/etc/cc-slurm-adapter/nats.creds"
}
3. NKey Authentication
{
"natsNKeySeedFile": "/etc/cc-slurm-adapter/nats.nkey"
}
See: NATS NKey Auth
Message Format
Jobs are published as JSON messages to the configured subject:
{
"jobId": "12345",
"cluster": "mycluster",
"user": "username",
"project": "projectname",
"startTime": 1234567890,
"stopTime": 1234567900,
"numNodes": 4,
"resources": { ... }
}
Use Cases
NATS integration is useful for:
- Real-time Monitoring: Other services can subscribe to job events
- Event-Driven Workflows: Trigger actions when jobs start/stop
- Alternative to REST: Can disable REST submission and use NATS-only
- Multi-Component Architecture: Multiple services consuming job events
Performance Considerations
- NATS adds minimal latency (typically < 1ms)
- Messages are fire-and-forget (no delivery guarantees by default)
- Consider using NATS JetStream for persistent queues if needed
Dual Submission Mode
By default, the adapter submits jobs to both cc-backend REST API and NATS:
{
"ccRestSubmitJobs": true,
"natsServer": "mynatsserver.example"
}
This ensures:
- cc-backend receives authoritative job data
- Other services can react to job events in real-time
NATS-Only Mode
For specialized deployments, you can disable REST submission:
{
"ccRestSubmitJobs": false,
"natsServer": "mynatsserver.example"
}
Warning: In this mode, you must ensure another component (e.g., a NATS subscriber) is forwarding job data to cc-backend, or jobs will not appear in the UI.
8 - Web Interface
Home
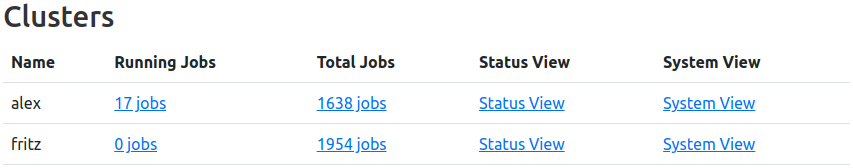
ClusterCockpit home table for two configured clusters
The entrypoint for each login via the login mask is a table containing each configured cluster as a row with the following columns:
- Name: The configured clusters’ name
- Running Jobs: Number of Jobs currently running longer than 5 minutes (or configured
shortRunningamount of time)- Clicking the Link will forward to the job list with preset filters for cluster and running jobs
- Total Jobs: Number of Jobs in the respective job-archive
- Clicking the Link will forward to the job list with preset filter for cluster
- Status View: Link to the status dashboard of the respective cluster
- This column is only shown for users with admin authority.
- Systems View: Link to the node overview of the respective cluster
- This column is only shown for users with admin authority.
Navigation Bar
The navigation bar allows direct access to ClusterCockpits’ different views and functions. Depending on the users’ authorization, the selectable views can differ.
For most viewports, the navigation bar is rendered fully expanded:

| Item | Title | Description |
|---|---|---|
| 1 | Home Button | Leads back to the home table |
| 2 | Views | Leads to ClusterCockpits’ different views, will change dependent on user authority |
| 3 | Searchbar | Top-Level Searchbar, see full usage information here |
| 4 | Documentation | Leads to this Documentation |
| 5 | Settings | Leads to ClusterCockpit settings page |
| 6 | Logout | Logs out the active user |
Adaptive Render Versions
On smaller viewports, the navigation bar will be rendered in one of two collapsed states:

Partially collapsed navigation bar. ‘Groups’ will expand to show links for Users, Projects, Tags, and Nodes views. ‘Stats’ will expand to show links for Analysis and Status views. Searchbar, Logout and Settings not shown here, but are still rendered explicitly in this case.
On mobile devices, the navigation bar as a whole is reduced into a burger navigation icon, and will display all views, as well as the searchbar, as stacked navigation menu.
8.1 - Settings
The settings view allows non-privileged users to choose their preferred paging style, to customize how metric plots are rendered, and to generate personalized tokes for use with the API. Customization options include line width, number of plots per row (where applicable), whether backgrounds should be colored, and the color scheme of multi-line metric plots.
If required, users can also enable a color blind friendly mode here. Different variants of color schemes for timeseries plots will be displayed and can be chosen as before. Other adaptions for better clarity include: Timeseries plot colored backgrounds, statistics data rendering, pie and stacked chart color schemes.
Privileged users will find an additional interface for choosing the preferred paging style used in the node list view.
Administrators will also find an administrative interface for handling local user accounts. This includes creating local accounts from the interface, editing user roles, listing and deleting existing users, generating JSON Web Tokens for API usage, and delegating managed projects for manager role users.
Apart from user management options, administrators have acces to multiple tools such as presentation mode, resampling information (if configured), homepage notice editing, and access to the public cluster status dashboards (BETA).
User Options
Settings available to the User Role are:
| Field | Options | Note |
|---|---|---|
| Job List Paging Type | Classic / Continuous | Style of paging in job list and user job list |
| Line Width | # Pixels | Width of the lines in the timeseries plots |
| Plots Per Row | # Plots | How many plots to show next to each other on pages such as the job or nodes views |
| Colored Backgrounds | Yes / No | Color plot backgrounds indicating mean values within warning thresholds |
| Color Blind Mode | Yes / No | Whether to use color vision deficiency friendly palettes across the webinterface |
| Color Scheme | See Below | Render multi-line metric plots in different color ranges. Will change to CVD-Friendly palettes if Color Blind Mode is active |
Generate JWT
This function will generate and return a personalized JWT, printed into the “Display JWT” field.
If working with the ClusterCockpit API, this token is required to authorize the user against the REST API endpoints.
Color Schemes
| Name | Colors |
|---|---|
| Default | |
| Autumn | |
| Beach | |
| BlueRed | |
| Rainbow | |
| Binary | |
| GistEarth | |
| BlueWaves | |
| BlueGreenRedYellow |
CVD-Friendly Color Schemes
These color palettes are based on https://personal.sron.nl/~pault/ and https://tsitsul.in/blog/coloropt/
| Name | Colors |
|---|---|
| HighContrast | |
| Bright | |
| Muted | |
| NormalSixColor | |
| NormalTwelveColor |
Support Options
Settings available to the Support User Role are:
| Field | Options | Note |
|---|---|---|
| Node List Paging Type | Classic / Continuous | Style of paging in node list view |
Admin Options
Create User
New users can be created directly via the web interface. On successful creation a green response message will be returned, and the user is directly visible in the “Special Users” table - If the user has at least two roles, or a single role other than user.
Error messages will also be displayed if the user creation process failed. No user account is saved to the database in this case.
| Field | Option | Note |
|---|---|---|
| Username (ID) | string | Required, must be unique |
| Password | string | Only API users are allowed to have a blank password, users with a blank password can only authenticate via JW tokens |
| Project | string | Only manager users can have a project |
| Name | string | Name of the user, optional, can be blank |
| Email Address | string | Users email, optional, can be blank |
| Role | Select one | See roles for more detailed information |
API | Allowed to interact with REST API | |
| Default | User | Same as if created via LDAP sync |
Manager | Allows to inspect jobs and users of given project | |
Support | Allows to inspect jobs and users of all projects, has no admin view or settings access | |
Admin | General access |
Special Users

This table does not contain users who only have user as their only role saved in the database. This is the case for all users created by LDAP import, and thus, these users will not be shown here. However, LDAP users’ roles can still be edited, and will appear in the table as soon as a authority higher than user or two authorities were granted.
All other special case users, e.g. new users manually created with support role, will appear in the list.
User accounts can be deleted by pressing the respective function displayed for each user entry - A verification pop-up window will appear to stop accidental user deletion.
Additionally, JWT tokens for specific users can be generated here as well.
| Column | Example | Description |
|---|---|---|
| Username | abcd1 | Username of this user |
| Name | Paul Atreides | Name of this user |
| Project(s) | abcd | Managed project(s) of this user |
demo@demo.com | Email adress of this user | |
| Roles | admin,api | Role(s) of this user |
| JWT | Press button to reveal freshly generated token | Generate a JWT for this user for use with the CC REST API endpoints |
| Delete | Press button to verify deletion | Delete this user |
Edit User Role
On creation, users can only have one role. However, it is allowed to assign multiple roles to an user account. The addition or removal of roles is performed here.
Enter an existing username and select an existing (for removal) or new (for addition) role in the drop-down menu.
Then press the respective button to remove or add the selected authority from the user account. Errors will be displayed if existing roles are added or non-existing roles are removed.
Edit Managed Projects
On creation, users can only have one managed project. However, it is allowed to assign multiple projects to a manager account. The addition or removal of projects is performed here.
Enter an existing username and select an existing (for removal) or new (for addition) project by entering the respective projectId.
Then press the respective button to remove or add the selected project from the manager account. Errors will be displayed if existing projects are added, non-existing projects are removed, or if the user account is not authorized to manage projects at all.
Scramble Names (Presentation Mode)
Activating this switch will replace all user names, person names, and project names with random strings. Intended for presentations on a production system while retaining critical information from a publc audience.
Public Dashboard Links (BETA)
Collected here are links per cluster leading to the “Public” version of cluster status dashboards. These are intended to be displayed on publicly displayed screens to inform users of the current cluster health in publicly accessible areas.
Metric Plot Resampling
If “Resampling” of metric plots is enabled in the configuration file (config.json), and read correctly on start-up, this informational display will list both the amount of data points on whichthe next resolution will be requested (“Trigger”) as well as the applicable resolutions themselves.
Note: Changes to the resampling options have to be perfofmed by changing the configuration file and restarting the application.
Edit Notice Shown On Homepage
The contents of the text form field will be written into $CCPATH/var/notice.txt on submission. If this file does not exist, it will be created.
If any content is found, an informational card will be rendered above the home site table. The content will also be mirrored within the form field itself.
Removing any content from the form field, and submitting, will clear the file and remove the rendered card from the homepage. This state is indicated by the placeholder text “No Content.” being shown in the form field.
8.2 - Searchbar

ClusterCockpit Searchbar
The top searchbar will handle page wide searches either by entering a searchterm directly as <query>, or by using a “keyword” implemented in the form of <keyword>:<query>. Entering a searchterm directly will start a hierarchical search which will return the first match in the hierarchy (see table below). It is recommended to supply the search with a keyword to specify the searched entity. For example, jobName:myJobName will specifically search for all jobs which have the queried string (or a part thereof) in their metadata jobName field. For all keywords with examples, see the table below.
Both keywords and queries are trimmed of all spaces before performing the search, returning the same results independently of location and number of spaces, e.g. name : Paul and name: paul are both handled identically.
Unprocessable queries will return a message detailing the cause of the error.
Available Keywords
| Keyword | Example Query | Destination | Note |
|---|---|---|---|
| No Keyword Used | abcd100 | Joblist or User Joblist | Performs hierarchical search jobId -> username -> name -> projectId -> jobName |
| JobId | jobId:123456 | Joblist | Allows multiple identical matches, e.g. JobIds from different clusters |
| JobName | jobName:myJobName | Joblist | Works with partial queries. Allows multiple identical matches, e.g. JobNames from different clusters. An additional Last 30 Days filter is active by default. |
| ProjectId | projectId:abcd100 | Joblist | All Jobs of the given project |
| Username | username:abcd100a | Users Table | Only active users are returned. Users without jobs are not shown. An additional Last 30 Days filter is active by default. Admin Only |
| Name | name:Paul | Users Table | Works with partial queries. Only active users are returned. Users without jobs are not shown. An additional Last 30 Days filter is active by default. Admin Only |
| ArrayJobId | arrayJobId:891011 | Joblist | All Jobs of the given arrayJobId. An additional Last 30 Days filter is active by default. |
8.3 - Plots
Most plots visible in the ClusterCockpit webinterface are implemented via uPlot or Chart.js, which both offer various functionality to the user.
Metric Plots
The main plot component of ClusterCockpit renders the metric values retrieved from the systems in a time dependent manner.
Interactivity
A selector crosshair is shown when hovering over the rendered data, data points corresponding to the legend are highlighted.
It is possible to zoom in by dragging a selection square with your mouse. Double-Clicking into the plot will reset the zoom.
normal metric threshold at first, i.e. the threshold will either be the highest rendered value (spaced line), or will be used to cut-off outliers (10 x normal threshold). Resetting by double-clicking will re-render the plot with regard to the highest value of the dataset, i.e. adapt the Y-axis to match said maximum value.Resampling of Data
If “Resampling” of metric plots is enabled in the configuration file (config.json), data is primarily loaded on the coarsest resolution. Zooming into the dataset, as described above, will continuously trigger a reload of the data in finer resolutions, until the highest resolution is reached. A finer resolution is requested from the backend as soon as the number of visible data points falls below a configured amount (“Trigger”).
Please note: While archived data is read from disk, and therefore can be resampled in the backend directly, resampling of data for running jobs requires the use of a matching version of CC-Metric-Store.
Running Job metric data read from older versions of CCMS will still return correctly, but will always return in the metrics configured timestep.
Conditional Legends
Hovering over the rendered data will display a legend as hovering box colored in yellow. Depending on the amount of data shown, this legend will render differently:
- Single Dataset: Runtime and Dataset Identifier Only
- 2 to 6 Datasets: Runtime, Line Color and Dataset Identifier
- 7 to 12 Datasets: Runtime and Dataset Identifier Only
- More than 12 Datasets: No Legend
- Statistics Datasets: Runtime and Dataset Identifier Only (See below)
The “no legend” case is required to not clutter the display in case of high data volume, e.g. core granularity data for more than 128 cores, which would result in 128 legend entries, possibly blocking the plotting area of metric graphs below.
Example

Eight datasets result in an average value within expected parameters, the background remains white. The legend displays each allocated hostname as dataset identifier.
Colored Backgrounds
The plots’ background is colored depending the average value of the viewed metric in respect to its configured threshold values. The three cases are
- White: Metric average within expected parameters. No performance impact.
- Yellow: Metric average below expected parameters, but not yet critical. Possible performace impact.
- Red: Metric average unexpectedly low. Indicator for suboptimal usage of resources. Performance impact to be expected.
Example

Two datasets result in an average value of less than the configured ‘alert’ threshold: The legend displays both identifiers with their respective color, while the background is colored in red to indicate suboptimal metric performance.
Statistics Variant
In the job list views, high amounts of data are by default rendered as a statistical representation of the numerous, single datasets:
- Maximum: The maximum values of the base datasets of each point in time, over time. Colored in green.
- Median: The median values of the base datasets of each point in time, over time. Colored in black.
- Minimum: The minimal values of the base datasets of each point in time, over time. Colored in red.
Example

A job with a high count of allocated nodes, running well within expected metric parameters. Since, by definition, the colors for this statistical render are always identical, only the runtime and the statistic datasets’ identifiers are shown.
Histograms
Histograms display (binned) data allowing distributions of the repective data source to be visualized. Data highlighting, zooming, and resetting the zoom work as described for metric plots.
Example

Duration distribution of selected jobs. The legends will display the X-Axis value label first, then the Y-Axis value label. The legend is shown for each bar individually when hovering the selection crosshair over the inspected bar. A highlight will show as white dot at the top.
Roofline Plot
A roofline plot, or roofline model, represents the utilization of available resources as the relation between computation and memory usage.
Bubble Roofline
The roofline models shown in the status dashboard views are rendered as bubble scatterplots. Utilization data represents either the job-average or the node-average of the last 5 minutes of sampled data, i.e running jobs or reported node metrics.
Additional information is rendered by color and size of the bubbles, depending on the data source:
| Type | Color | Size |
|---|---|---|
| Node Roofline | The current scheduler state of the node. | The current number of parallel jobs currently running on the node. |
| Job Roofline | The current job duration. | The amount of resources used by the job (Number of allocated nodes OR number of allocated accelerators). |
Clicking on a bubble will open a new tab with either the respective jobs’ detail view, or the respective nodes’ metric overview.
Example

Roofline models as shown for a subcluster. Legend on hover displays additional information as written text.
Scatter Roofline
The roofline model shown in the job detail view is rendered as dotted scatterplot. It renders every sampled utilization data point colored by time.
Example

Roofline model as shown for a single job. Time information is encoded in the color range, starting from blue dots and ending in red dots.
Heatmap Roofline
The roofline model shown in the analysis view is rendered as a heatmap. This is due to the data being displayed is derived from a number of jobs greater than one, since the analysis view returns all jobs matching the selected filters. The roofline therefore colors regions of accumulated activity in increasing shades of red, depicting the regions below the roofs in which the returned jobs primarily perform.
Example

In this example, the selected jobs perform in near optimal, as depicted by increased job activity right below the first ‘knee’ of the roofline model.
Double Metric Plot
Variant of the default metric plot rendering data on Y1 and Y2 axes over time. Currently only used in status dashboards to display cluster-wide memory bandwidth and flops per second sums, scaled to Tera (1012), as a measure of cluster utilization.
Example

mem_bw (blue) and flops_any (red) metrics as time-dependent sums over all nodes of cluster alex. In this example, the data is shown for the last 8 hours of 80 nodes.
Stacked State Plot
For indicating the development of reported cluster scheduler node states, or metric health states, a stacked representation of the counts over time is used. The sum of all timeseries Y-values is representative of the total sum of reporting nodes.
| Color | Green | Yellow | Red | Blue | Magenta | Black |
|---|---|---|---|---|---|---|
| Scheduler States | Allocated | Mixed | Down | Idle | Reserved | Unknown |
| Health States | Full | Partial | Failed | - | - | - |
Example

In this example, a total of 250 nodes reported their respective state information for the last four hours. ‘Node States’ report minor fluctuations of four states currently present within the cluster. ‘Health States’ report optimal quality of the transmitted metrics during an identical timeframe.
Pie Charts
Current distributions of, for example, top usage information for clusters, or the latest state of node health (see above), will be rendered using classic pie chart representation. Pie charts in ClusterCockpit are always accompanied by a color legend as well as a table representation of the data. Entities such as users or projects are always linked and will lead to the respective view in a new tab.
Example

Pie charts representing top usage by job count for single users and project groups, respectively (Name scrambling is active). Color scheme of pie charts will change if color blind mode is enabled.
Polar Plots
A polar, or radar, plot represents the utilization of key metrics. Both the maximum and the average utilization as a fraction of the 100% theoretical maximum (labelled as 1.0) are rendered on a number of axes equal to the displayed key metrics. This leads to an increasing area, which in return marks increasingly optimal resource usage. In principle, this is a graphic representation of data also shown in the footprint component.
By clicking on one of the two legends, the respective dataset will be hidden. This can be useful if high overlap reduces visibility.
Example

In this example, the selected job performs quite well, as depicted in the acceptable and equally distributed usage of core metrics. On average, all three metrics are utilized at about 20% (0.2) of the configured hardware maximum. At a point in time, the maximum even reached close to 100% (1.0) of the memory bandwidth (mem_bw).
Comparogram
A special plot coined “Comparogram” to display information about multiple jobs, sorted by start_time-timestamp, for comparison purposes.
Used in the “Job Compare”-functionality, the top plot always shows the allocated resources of the compared jobs in a semi-logarithmic manner, with X the JobID and Y the resource count. Three types of resources are rendered, if found: Nodes (Black line, always at least with a value of 1), Threads (Blue line, always at least with a value of 1), and Accelerators (Red line, can be 0).
The resource compare plot is always accompanied by (at least) one metric comparison plot. For the selected metric, the job statistics calculated over the full runtime of the respective job are rendered, and plotted according to job start timestamp.
To make localization of interesting artifacts easier, the pointer is synchronized between all rendered compare plots in the compare view.
Example

Example of compare plot usage. Top plot shows resource usage of jobs running on a CPU-Only cluster, with additional information in the legend per hovered job. The second plot shows the mem_used metric statistics for each compared job with an easily recognizable peak, probably due to the high resource allocation of the respective job.
Scatter / Bubble Plot
Bubble scatter plots show the position of the averages of two selected metrics in relation to each other.
Each circle represents one job, while the size of a circle is proportional to its node hours. Darker circles mean multiple jobs have the same averages for the respective metric selection.
Example

In this example, the selected metrics are accelerator clock on the X-axis and accelerator temperature on the Y-axis. Expectedly, long running, high-clock jobs accumulate in the top-right corner, while jobs with less demanding (less clocking) jobs remain cooler.
8.4 - Filters

Filter Button as displayed in Job List Views
The ClusterCockpit filter component is used for reducing the number of jobs, either for direct display in job list views, or to specifiy the data-source for collecting information displayed in user or project tables, as well as the analysis view.
Filter Options

Three active filters have reduced the total job count considerably
Multiple filters can be easily combined by selecting more than one option of the available filters.
By clicking on the respective filter pill, colored in blue, and located right of the filter component, one can directly access the respective filters’ menu for editing, or removing, the filter.
At the moment, the following filters are implemented:
Cluster/Partition

Select a configured cluster, or a specified partition of a given cluster, and display only jobs started on that cluster (and partition).
Options: All cluster names, and nested partition names, configured in config.json
Default: Any Cluster (Any Partition)
Job States

Select one or more job states, and display only jobs matching the selected criteria. Additionally, filters for resource sharing as well as processing type can be selected. Combinations are possible, for example: Only Running, Shared, Batch Processed Jobs.
A note on sharing option nomenclature: Select options are chosen to be “Human Readable”, while the strings used in the backend database column job.shared differ as follows:
| Option Name | Database String |
|---|---|
| All | No Filter Applied |
| Exclusive | none |
| Shared | multi_user |
| Multitask | single_user |
- State Options:
Pending, Running, Completed, Failed, Timeout, Deadline, Preempted, Suspended, Cancelled, Out_of_memory, Boot_fail, Node_fail - Sharing Options:
All, Exclusive, Shared, Multitask - Processing Options:
All, Interactive, Batch Processed
Default: All states, all sharing types, all processing types
meta_data.jobName == 'interactive'! If interactive jobs are permitted on your site, but use a different naminig scheme or a different method to differentiate them from batch processed jobs, please contact or support mail adress.Start Time

Select the timeframe in which jobs were started, and display only jobs matching the selected criteria.
Options: Free selection of date dd.mm.YYYY and time hh:mm for from and to limits.
Default: All Starttimes
Preset: Jobs started one month ago until $now
Duration

Select the duration of jobs, and display only jobs matching the selected criteria.
Options: Duration less than hh:mm, duration more than hh:mm, duration between two duration selections. Only one of the three options can be used at a time.
Default: All Durations
Tags

Select one or more job tags, and display only jobs tagged with the selected tags.
Options: All available tags. It is possible to search within the list of tags.
Default: No selection
Resources

Select a named node or specify an amount of used resources, and display only jobs matching the selected criteria.
Options:
- Named node free text field: Enter a hostname here to only return jobs which were ran on this node. Select the desired match logic (Defaults to “Equal”, i.e. exact match).
- Range selectors: Select a range of allocated job resources ranging from the minimal to the maximum configured resource count of all clusters. If the cluster filter is set, the ranges are limited to the respective resources’ configuration. Available resources are:
- Nodes
- HWThreads
- Accelerators (if available)
Default: No named node, full resource ranges of all configured clusters
Energy
Specify total consumed energy, and display only jobs matching the selected range.
Options: “Total Job Energy” in kWh.
Default: No selection
running.Statistics

Specify ranges of metric statistics, and display only jobs matching the selected criteria.
footprint flag is set in the respective metrics’ configuration will be available here.Example Options:
- FLOPs (Avg.): Select Range
From-Toby dragging the slider or entering values directly. - Memory Bandwith (Avg.): Select Range
From-Toby dragging the slider or entering values directly. - Load (Avg.): Select Range
From-Toby dragging the slider or entering values directly. - Memory Used (Max.): Select Range
From-Toby dragging the slider or entering values directly.
Default: Full metric statistics ranges as configured
Short Jobs Quick Selections
Quickly select whether to only show or exclude short jobs with a duration of less than a configured runtime. Will display as a normal duration filter.
If no other setting for short-running-jobs-duration is used, the default cutoff is 5 minutes.
Options: Only Short Jobs, Exclude Short Jobs
Default: No selection
Start Time Quick Selections
Quickly select a preconfigured range of job start times. Will display as named start time filter.
When the returned URL is copied and shared, the named filter value will transfer over.
Options: Last 6 hours, Last 24 hours, Last 7 Days, Last 30 Days
Default: No selection
8.5 - Views
Usage descriptions for each view of the ClusterCockpit web interface.
8.5.1 - My Jobs

Personal User Job View. Similar to the general job list view, this view expands it by user-specific meta data, as well as distributions histograms.
The “My Jobs” View is available to all users regardless of authority and displays the users personal jobs, i.e. jobs started by this users username on the cluster systems.
The view is a personal variant of the user job view and therefore also consists of three components: Basic Information about the users jobs, selectable statistic histograms of the jobs, and a generalized job list.
Users are able to change the sorting, select and reorder the rendered metrics, filter, and activate a periodic reload of the data.
User Information and Basic Distributions
The top row always displays personal usage information, independent of the selected filters. Information displayed:
- Username
- Person Name (if available in DB)
- Total Jobs
- Short Jobs (as defined by the configuration, default: less than 5 minute runtime)
- Total Walltime
- Total Core Hours
Additional histograms depicting the distribution of job duration and number of nodes occupied by the returned jobs are affected by the selected filters. The binning of the duration histogram can be selected by the user. The options are as follows:
| Bin Size | Number of Bins | Maximum Displayed Duration |
|---|---|---|
| 1 Minute (1m) | 60 | 1 Hour |
| 10 Minute (10m) | 72 | 12 Hours |
| 1 Hour (1h, Default) | 48 | 2 Days |
| 6 Hours (6h) | 12 | 3 Days |
| 12 Hours (12h) | 14 | 1 Week |
Selectable Histograms
Histograms depicting the distribution of the selected jobs’ statistics can be selected from the top navbar “Select Histograms” button. The displayed data is based on the jobs returned from active filters, and will be pulled from the database.
The binning of the statistics histograms can be selected by the user, the bin limits are calculated automatically.
The options are as follows: 10 (Default), 20, 50, 100.
footprint flag is set in the respective metrics’ configuration will be available here.Job List
The job list displays all jobs started by your username on the systems. Additional filters will always respect this limitation. For a detailed description of the job list component, see the related documentation.
Job Compare
The job list also allows comparison of either user selected jobs or of all job listed, if the total number of jobs does not exceed 500 matches. For a detailed description of the job list component, see the related documentation.
8.5.2 - User Jobs
User Job View. Similar to the general job list view, this view expands it by user-specific meta data, as well as distribution histograms.
The “User Jobs” View is only available to management and supporting staff and displays jobs belonging to a single user other than the active user, i.e. jobs started by other users on the cluster systems can be reviewed in detail by the supporting staff or administrators.
The view consists of three components: Basic Information about the users jobs, selectable statistic histograms of the jobs, and a generalized job list.
Users are able to change the sorting, select and reorder the rendered metrics, filter, and activate a periodic reload of the data.
User Information and Basic Distributions
The top row always displays information about the user, independent of the selected filters.
Information displayed:
- Username
- Person Name (if available in DB)
- Total Jobs
- Short Jobs (as defined by the configuration, default: less than 5 minute runtime)
- Total Walltime
- Total Core Hours
Additional histograms depicting the distribution of job duration and number of nodes occupied by the returned jobs are affected by the selected filters. The binning of the duration histogram can be selected by the user. The options are as follows:
| Bin Size | Number of Bins | Maximum Displayed Duration |
|---|---|---|
| 1 Minute (1m) | 60 | 1 Hour |
| 10 Minute (10m) | 72 | 12 Hours |
| 1 Hour (1h, Default) | 48 | 2 Days |
| 6 Hours (6h) | 12 | 3 Days |
| 12 Hours (12h) | 14 | 1 Week |
Selectable Histograms
Histograms depicting the distribution of the selected jobs’ statistics can be selected from the top navbar “Select Histograms” button. The displayed data is based on the jobs returned from active filters, and will be pulled from the database.
The binning of the statistics histograms can be selected by the user, the bin limits are calculated automatically.
The options are as follows: 10 (Default), 20, 50, 100.
footprint flag is set in the respective metrics’ configuration will be available here.Job List
The job list displays all jobs started by this users username on the systems. Additional filters will always respect this limitation. For a detailed description of the job list component, see the related documentation.
Job Compare
The job list also allows comparison of either user selected jobs or of all job listed, if the total number of jobs does not exceed 500 matches. For a detailed description of the job list component, see the related documentation.
8.5.3 - Job List

Job List. In this example, the optional footprint is displayed, two filters are active, and the table is refreshed every minute. The first job has a high node count, therefore the plots are rendered in the statistics variant. The ‘mem_bw’ metric likely has artifacts as shown by the grey footprint. The second job has tags and displays less than optimal performance in the ‘flops_any’ metric, coloring the respective plot background in orange.
The primary view of ClusterCockpits webinterface is the tabular listing of jobs, which displays various information about the jobs returned by the selected filters. This information includes the jobs’ full meta data, such as runtime or job state, as well as an optional footprint, allowing quick assessment of the jobs performance.
Most importantly, the list displays a selectable array of metrics as time dependent metric plots, which allows detailed insight into the jobs performance at a glance.
manager role, this view is labelled as ‘Managed Jobs’. Displayed jobs are limited to jobs started by users of the managed projects (usergroups), otherwise the functionality is identical, e.g. filtering or footprint display.Job List Toolbar

Several options allow configuration of the displayed data, which are also persisted for each user individually, either for general usage or by cluster.
Sorting
Basic selection of sorting parameter and direction. By default, jobs are sorted by starting timestamp in descending order (latest jobs first). Other selections to sort by are
- Duration
- Number of Nodes
- Number of Hardware-Threads
- Number of Accelerators
- Total Energy Consumed
- Additional configured Metric Statistics
- …
footprint flag is set in the respective metrics’ configuration will be available as additional sorting options.Switching of the sort direction is achieved by clicking on the arrow icon next to the desired sorting parameter.
Metrics
Selection of metrics shown in the tabular view for each job. The list is compiled from all available configured metrics of the ClusterCockpit instance, and the tabular view will be updated upon applying the changes.

In addition to the metric names themselves, the availability by cluster is indicated as comma seperated list next to the metric identifier. This information will change to the availablility by partition if the cluster filer is active.
It is furthermore possible to edit the order of the selected metrics. This can be achieved by dragging and dropping the metric selectors to the desired order, where the topmost metric will be displayed next to the “Job Info” column, and additional metrics will be added on the right side.
Lastly, the optional “Footprint” Column can be activated (and deactivated) here. It will always be rendered next to the “Job Info” column, while metrics start right of the “Footprint” column, if activated.
Filters
Selection of filters applied to the queried jobs. By default, no filters are activated if the view was opened via the navigation bar. At multiple location throughout the web-interface, direct links will lead to this view with one or more preset filters active, e.g. selecting a clusters’ “running jobs” from the home page will open this view displaying only running jobs of that cluster.
Possible options are:
- Cluster/Partition: Filter by configured cluster (and partitions thereof)
- Job State: Filter by defined job state(s)
- Start Time: Filter by start timestamp
- Duration: Filter by job duration
- Tags: Filter by tags assigned to jobs
- Resources: Filter by allocated resources or named node
- Energy: Filter by consumed total energy (for completed jobs only)
- Statistics: Filter by average usage of defined metrics
Each filter and its default value is described in detail here.
Job Count
The total number of jobs returned by the backend for the given set of filters.
Search and Reload
Search for specific jobname, project or username (privileged only) using the searchbox by selecting from the dropdown and entering the query.
Force a complete reload of the table data, or set a timed periodic reload (30, 60, 120, 300 Seconds).
Search for specific project

If the Job-List was opened via a ProjectId-Link or the Projects List, the text search will be fixed to the selected project, and allows for filtering jobnames and users in that project, as indicated by the placeholder text.
If desired, the fixed project can be removed by pressing the button right of the input field, returning the joblist to its default state.
Compare Jobs
This button is used to compare either a selected number of jobs or all jobs currently matching the selected filters by switching to the job comparison view.
Users can select the to be compared jobs in the [job info](#job-info section via the selector checkbox in the upper right corner. Alternatively, every combination of job list filters can be used to generate a comparison set.
Job List Table
The main component of the job list view renders data pulled from the database, the job archive (completed jobs) and the configured metric data source (running jobs).
Job Info
The meta data containing general information about the job is represented in the “Job Info” column, which is always the first column to be rendered. From here, users can navigate to the detailed view of one specific job as well as the user or project specific job lists.
| Field | Example | Description | Destination |
|---|---|---|---|
| Job Id | 123456 | The JobId of the job assigned by the scheduling daemon | Job View |
| Job Name | myJobName | The name of the job as supplied by the user | - |
| Username | abcd10 | The username of the submitting user | User Jobs |
| Project | abcd | The name of the usergroup the submitting user belongs to | Joblist with preset Filter |
| Resources | n100 | Indicator for the allocated resources. Single resources will be displayed by name, i.e. exclusive single-node jobs or shared resources. Multiples of resources will be indicated by icons for nodes, CPU Threads, and accelerators. | - |
| Partition | main | The cluster partition this job was startet at | - |
| Start Timestamp | 10.1.2024, 10:00:00 | The epoch timestamp the job was started at, formatted for human readability | - |
| Duration | 0:21:10 | The runtime of the job, will be updated for running jobs on reload. Additionally indicates the state of the job as colored pill | - |
| Walltime | 24:00:00 | The allocated walltime for the job as per job submission script | - |
Two additional functions are located in the upper right corner of each job information segment for each job, namely, a helper to easily copy the respective job ID to the clipboard as well as the selector checkbox to mark the respective job for job comparison (see above).
Footprint
The optional footprint column will show base metrics for job performance at a glance, and will hint to performance (and performance problems) in regard to configurable metric thresholds.
footprint flag is set in the respective metrics’ configuration will be shown in this view.Examples:
| Field | Description | Note |
|---|---|---|
| cpu_load | Average CPU utilization | - |
| flops_any | Floprate calculated as f_any = (f_double x 2) + f_single | - |
| mem_bw | Average memory bandwidth used | Non-GPU Cluster only |
| mem_used | Maximum memory used | Non-GPU Cluster only |
| acc_utilization | Average accelerator utilization | GPU Cluster Only |
Colors and icons differentiate between the different warning states based on the configured threshold of the metrics. Reported metric values below the warning threshold simply report bad performance in one or more metrics, and should therefore be inspected by the user for future performance improvement.
Metric values colored in blue, however, usually report performance above the expected levels - Which is exactly why these metrics should be inspected as well. The “maximum” thresholds are often the theoretically achievable performance by the respective hardware component, but rarely are they actually reached. Inspecting jobs reporting back such levels can lead to averaging errors, unrealistic spikes in the metric data or even bugs in the code of ClusterCockpit.
| Color | Level | Description | Note |
|---|---|---|---|
| Blue | Info | Metric value below maximum configured peak threshold | Job performance above expected parameters - Inspection recommended |
| Green | OK | Metric value below normal configured threshold | Job performance within expected parameters |
| Yellow | Caution | Metric value below configured caution threshold | Job performance might be impacted |
| Red | Warning | Metric value below configured warning threshold | Job performance impacted with high probability - Inscpection recommended |
| Dark Grey | Error | Metric value extremely above maximum configured threshold | Inspection required - Metric spikes in affected metrics can lead to errorneous average values |
Metric Row
Selected metrics are rendered here in the selected order as metric lineplots. Aspects of the rendering can be configured at the settings page.
8.5.4 - Job Comparison

Job list with compare switch. In this example, filters return 145 jobs, while no job is selected manually.
Accessible from the general job list as well as the user view job lists, the job compare view allows for the comparison of metric statistics in a pseudo-time-dependent manner.
The “Compare Jobs” button is located in the upper right corner of the job list views. Jobs for comparison are either selected by
- … a combination of filters resulting in a dataset of 500 jobs or less.
- … manual job selection by checking the box in the job info card.
If too many jobs are returned by the current filter selection, the button will be disabled.
If jobs are directly selected from the current job list, the button will display the current count, as well as an additional “Reset” button, which will empty the list of selected jobs, if pressed.
Manual job selection will also work if the current job list has more than 500 returned jobs, while the subsequent job compare view will ignore all additional filters, and only show selected jobs. Returning to the job list also returns with the last used filters.
Fixed Compare Elements

Job compare view top elements. The count of 145 jobs remains after switching to this view. The resource plot shows jobs sorted by their startTime, and all jobs have allocated accelerators (red data line).
The compare view features a reduced header:
- Sorting is disabled, as jobs are always sorted by
startTimein ascending order. - The filter component is removed and only shows the total number of compared jobs.
- The refresh component is also removed.
The “Metric Selection” is active and can be used to add additional metric comparison plots to the view, if desired.
“Return to List” closes the compare view and restores the former job list view.
The resource compare plot is always shown at the first position. It features a semi-logarithmic view of allocated job resources in a pseudeo-time-dependent manner, as all jobs are sorted by actual start time. The data is colored as follows:
- Black: Nodes - will always be at least
1(Note: Also for shared jobs!) - Blue: Hardware Threads ( ~ Cores)
- Red: Accelerators - Can be zero! If so, no line is rendered.
The legend includes further information, such as:
- Job-ID
- Cluster (and subCluster) on which the job ran
- Runtimeof the job
Selectable Compare Elements

Job compare view metric plot and table. ‘Clock’ metric statistics are plotted for every job sorted by their startTime. All information is also shown as sortable table at the bottom of the compare view.
Below the first plot, the individual metric compare plots are rendered. For each job, the Min/Max/Avg of the respective metric is plotted in a banded manner.
Zooming is possible, and will be synchronized to all other rendered plots, including the resource comparison.
Below the plots, all information is again rendered as a single table consisting of the following columns:
- JobID
- Start Time
- Duration
- Cluster
- Resources (Nodes, Threads , Accs)
- For each Metric: Minimum, Maximum, Average
It is possible to filter for specific jobIDs or parts thereof, all other columns are sortable.
Clicking on a JobID will lead to the respective Job View.
8.5.5 - Job

Job View. This example shows a completed, shared job with lacking ‘flops_any’ performance.
The job view displays all data related to one specific job in full detail, and allows detailed inspection of all metrics at several scopes, as well as manual tagging of the job.
Top Bar
The top bar of each job view replicates the “Job Info” and “Footprint” seen in the job list, and additionally renders general metric information in specialized plots.
For shared jobs, a list of jobs which run (or ran) concurrently is shown as well.
Job Information Tabs
Job Info
Identical to the job list equivalent, this component displays meta data containing general information about the job. From here, users can navigate to the detailed view of one specific job as well as the user or project specific job lists.
| Field | Example | Description | Destination |
|---|---|---|---|
| Job Id | 123456 | The JobId of the job assigned by the scheduling daemon. The icon on the right allows for easy copy to clipboard. | Job View |
| Job Name | myJobName | The name of the job as supplied by the user | - |
| Username | abcd10 | The username of the submitting user | User Jobs |
| Project | abcd | The name of the usergroup the submitting user belongs to | Joblist with preset Filter |
| Resources | n100 | Indicator for the allocated resources. Single resources will be displayed by name, i.e. exclusive single-node jobs or shared resources. Multiples of resources will be indicated by icons for nodes, CPU Threads, and accelerators. | - |
| Partition | main | The cluster partition this job was startet at | - |
| Start Timestamp | 10.1.2024, 10:00:00 | The epoch timestamp the job was started at, formatted for human readability | - |
| Duration | 0:21:10 | The runtime of the job, will be updated for running jobs on reload. Additionally indicates the state of the job as colored pill | - |
| Walltime | 24:00:00 | The allocated walltime for the job as per job submission script | - |
At the bottom, all tags attached to the job are listed. Users can manage attachted tags via the “manage X Tag(s)” button.
Concurrent Jobs
In the case of a shared job, a second tab next to the job info will display all jobs which were run on the same hardware at the same time. “At the same time” is defined as “has a starting or ending time which lies between the starting and ending time of the reference job” for this purpose.
A cautious period of five minutes is applied to both limits, in order to restrict display of jobs which have too little overlap, and would just clutter the resulting list of jobs.
Each overlapping job is listed with its jobId as a link leading to this jobs detailed job view.
Admin Note
Optional Tab that only shows if the supporting staff added a note to the job manually, or by the automatic tagging feature.
Usually contains information about notable job behaviours such as resource under-utilization.
Job Utilization Tabs
Footprint
Identical to the job list equivalent, this component will show base metrics for job performance at a glance, and will hint to job quality and problems in regard to configurable metric thresholds. In contrast to the job list, it is always active and shown in the detailed job view.
footprint flag is set in the respective metrics’ configuration will be shown in this view.Examples:
| Field | Description | Note |
|---|---|---|
| cpu_load | Average CPU utilization | - |
| flops_any | Floprate calculated as f_any = (f_double x 2) + f_single | - |
| mem_bw | Average memory bandwidth used | - |
| mem_used | Maximum memory used | Non-GPU Cluster only |
| acc_utilization | Average accelerator utilization | GPU Cluster Only |
Colors and icons differentiate between the different warning states based on the configured thresholds of the metrics. Reported metric values below the warning threshold simply report bad performance in one or more metrics, and should therefore be inspected by the user for future performance improvement.
Metric values colored in blue, however, usually report performance above the expected levels - Which is exactly why these metrics should be inspected as well. The “maximum” thresholds are often the theoretically achievable performance by the respective hardware component, but rarely are they actually reached. Inspecting jobs reporting back such levels can lead to averaging errors, unrealistic spikes in the metric data or even bugs in the code of ClusterCockpit.
| Color | Level | Description | Note |
|---|---|---|---|
| Blue | Info | Metric value below maximum configured peak threshold | Job performance above expected parameters - Inspection recommended |
| Green | OK | Metric value below normal configured threshold | Job performance within expected parameters |
| Yellow | Caution | Metric value below configured caution threshold | Job performance might be impacted |
| Red | Warning | Metric value below configured warning threshold | Job performance impacted with high probability - Inspection recommended |
| Dark Grey | Error | Metric value extremely above maximum configured threshold | Inspection required - Metric spikes in affected metrics can lead to errorneous average values |
Examples

Footprint of a job with performance well within expected parameters, ‘mem_bw’ even overperforms.

Footprint of an accelerated job with mixed performance parameters.

Footprint of a job with performance averages way above the expected maxima - Look for artifacts!
Polar Representation
Next to the footprints, a second tab will render the polar plot representation of the configured footprint metrics. Minimum, Average and Maximum ranges are rendered.
Roofline Representation
A roofline plot representing the utilization of available resources as the relation between computation and memory usage over time (color scale blue -> red). This plot is always shown separately.
Energy Summary

Energy Summary for a completed Job with Accelerators. Carbon Emission Estimate is activated.
For completed jobs, the energy estimates are shown below the top bar. Energy is shown in kilowatt hours for all contributing metrics. If a constant for g/kWh is configured, an additional estimate is calculated which displays the amount of carbon emissions.
Please note: Energy metrics displayed here are configured. All metrics, for which the energy flag is set in the respective metrics’ configuration will be shown in this view.
In addition, “Total Energy” is calculated as the sum of all configured metrics, regardless of their origin. I.e., if core_power and cpu_power are configured, both values contribute to the total energy.
Metric Plot Table
The views’ middle section consists of metric plots for each metric selected in the “Select Metrics” menu, which defaults to all configured metrics available to the jobs’ cluster and subCluster.
The data shown per metric defaults to the smallest available granularity of the metric with data of all nodes, but can be changed at will by using the drop down selectors above each plot.
If available, the statistical representation can be selected as well, by scope (e.g. stats series (node)).
Tagging

Manual tagging of jobs is performed by using the “Manage Tags” option.
Tags are categorized into three “Scopes” of visibility:
- Admin: Only administrators can create and attach these tags. Only visible for administrators and support personnel.
- Global: Administrators and support personnel can create and attach these tags. Visible for everyone.
- Private: Everyone can create and attach private tags, only visible to the creator.
Available tags are listed, colored by scope, and can be added to the jobs’ database entry simply by pressing the respective button.
The list can be filtered for specific tags by using the “Search Tags” prompt.
New tags can be created by entering a new type:name combination in the search prompt, which will display a button for creating this new tag. Privileged users](/docs/explanation/roles/#administrator-role “Admin Role”) will additionally be able to select the “Scope” (see above) of the new tag.
Statistics and Meta Data

Statistics Table. ‘cpu_power’ granularity is set to ‘socket’. Tabs above switch the contents to the job script or slurm information, both read from the jobs metadata field.
On the bottom of the job view, additional information about the job is collected. By default, the statistics of selected metrics are shown in tabular form, each in their metrics’ native granularity. Metrics are selected independently for the statistics table.
Statistics Table
The statistics table collects all metric statistical values (min, max, avg) for each allocated node and each granularity.
The metrics to be displayed can be selected using the “Select Metrics” selection pop-up window. In the header, next to the metric name, a second drop down allows the selection of the displayed granularity. If no other scopes than node are available, the drop down menu is disabled.
Core and Accelerator metrics default to their respective native granularities automatically.
For multi-node jobs, fine granularities are not requested from the backend from the start. A “Load Scopes” will allow for the later load of more scopes, which will apply to all selected metrics in the statistics table, and also to metrics selected later.
Job Script
This tab displays the job script with which whis job was started on the systems.
Slurm Info
This tab displays information returned drom the SLURM batch process management software.
Missing Metrics or Resources
If mismatches between the supposed availability of metrics and the returned data are detected, an optional tab will list all details for missing metrics and/or missing hardware nodes, which were not found in the metricdata stores.
8.5.6 - Users

User Table, sorted by ‘Total Jobs’ in descending order. In addition, active filters reduce the underlying data to jobs with more than one hour runtime, started on the GPU accelerated cluster.
This view lists all users which are, and were, active on the configured clusters. Information about the total number of jobs, walltimes and calculation usages are shown.
It is possible to filter the list by username using the equally named prompt, which also accepts partial queries.
The filter component allows limitation of the returned users based on job parameters like start timestamp or memory usage.
The table can be sorted by clicking the respective icon next to the column headers.
manager authority, this view will be titled ‘Managed Users’ in the navigation bar. Managers will only be able to see other user accounts of the managed projects.Details
| Column | Description | Note |
|---|---|---|
| User Name | The user account jobs are associated with | Links to the users’ job list with preset filter returning only jobs of this user and additional histograms |
| Name | The name of user | |
| Total Jobs | Users’ total of all started jobs | |
| Short Jobs | Users’ total of all jobs below short duration threshold (as defined by the configuration) | |
| Total Cores | Conditional, if running jobs: Users’ total of all cores allocated to currently running jobs | |
| Total Accelerators | Conditional, if running jobs: Users’ total of all accelerators allocated to currently running jobs | |
| Total Walltime | Users’ total requested walltime | |
| Total Core Hours | Users’ total of all used core hours | |
| Total Accelerator Hours | Users’ total of all used accelerator hours | Please Note: This column is always shown, and will return 0 for clusters without installed accelerators |
8.5.7 - Projects

Project Table, sorted by ‘Total Jobs’ in descending order. In addition, active filters reduce the underlying data to jobs with less than six hours runtime, started on the CPU exclusive cluster.
This view lists all projects (usergroups) which are, and were, active on the configured clusters. Information about the total number of jobs, walltimes and calculation usages are shown.
It is possible to filter the list by project name using the equally named prompt, which also accepts partial queries.
The filter component allows limitation of the returned projects based on job parameters like start timestamp or memory usage.
The table can be sorted by clicking the respective icon next to the column headers.
manager authority, this view will be titled ‘Managed Projects’ in the navigation bar. Managers will only be able to see colected data of managed projects.Details
| Column | Description | Note |
|---|---|---|
| Project Name | The project (usergoup) jobs are associated with | Links to a job list with preset filter returning only jobs of this project |
| Total Jobs | Project total of all started Jobs | |
| Short Jobs | Project total of all jobs below short duration threshold (as defined by the configuration) | |
| Total Cores | Conditional, if running jobs: Project total of all cores allocated to currently running jobs | |
| Total Accelerators | Conditional, if running jobs: Project total of all accelerators allocated to currently running jobs | |
| Total Walltime | Project total requested walltime | |
| Total Core Hours | Project total of all used core hours used | |
| Total Accelerator Hours | Project total of all used accelerator hours | Please Note: This column is always shown, and will return 0 for clusters without installed accelerators |
8.5.8 - Tags

This view lists all tags currently used within the ClusterCockpit instance:
- The
Tag Typeof the tag(s) is displayed as dark grey header, collecting all tags which share it, with a total count shown on the right. - The
Names of all tags sharing oneTag Type, the number of matching jobs per name, and the scope are rendered as pills below the header, colored accordingly (see below).
Each tags’ pill is clickable, and leads to a job list with a preset filter matching only jobs tagged with this specific label.
Tag Scopes
Tags are categorized into three “Scopes” of visibility, and colored accordingly:
- Admin (Cyan): Only administrators can create and attach these tags. Only visible for administrators and support personnel.
- Global (Purple): Administrators and support personnel can create and attach these tags. Visible for everyone.
- Private (Yellow): Everyone can create and attach private tags, only visible to the creator.
Remove Tags
Tags and all job attachements can be removed from the database if a red X symbol is attached to the tags’ pill. A confirmation popup will appear after which the tag and all attachements are deleted, and the tag is removed from th list.
The following rules apply:
- Only Administrators are authorized to remove tags with scopes “global” and “admin” via this functionality in this view.
- Managers and Support-Personnel can not remove “global” and “admin” tags from the database this way.
- Every User, including staff, can remove their own “private” tags (but not those of other users).
8.5.9 - Nodes
Node Overview

Nodes View. This example shows the last two hours of the ‘clock’ metric of eight nodes. Node ‘f0147’ of the ‘main’ partition has an average below the configured ‘alert’ threshold, and is colored in red.
The node overview is always called in respect to one specified cluster. It displays the current state of all nodes in that cluster in respect to one selected metric, rendered in form of metric plots, and independent of job meta data, i.e. without consideration for job start and end timestamps.
Overview Selection Bar

Selections regarding the display, and update, of the plots rendered in the node table can be performed here:
- Find Node:: Filter the node table by hostname. Partial queries are possible.
- State:: Filter the node table by last reported node state.
- Displayed Timerange: Select the timeframe to be rendered in the node table
Custom: Select timestampfromandtoin which the data should be fetched. It is possible to select date and time.15 Minutes, 30 Minutes, 1 Hour, 2 Hours, 4 Hours, 12 Hours, 24 Hours
- Metric:: Select the metric to be fetched for all nodes. If no data can be fetched, messages are displayed per node.
- (Periodic) Reload: Force reload of fresh data from the backend or set a periodic reload in specified intervals
30 Seconds, 60 Seconds, 120 Seconds, 5 Minutes
Node Table
Nodes (hosts) are ordered alphanumerically in this table, rendering the selected metric in the selected timeframe.
Each heading links to the singular node view of the respective host.
A colored pill indicates the currently reported node state for that node.
Node List

Nodes View.
The node list view is also always called in respect to one specified cluster, and optionally, subCluster. It displays the current state of all nodes in that cluster (or subCluster) in respect to a selectable number, and order, of metrics. Plots are rendered in form of metric plots, and are independent of job meta data, i.e. without consideration for job start and end timestamps.
The always visible “Node Info”-Card displays the following information. “List”-Bottons will lead to according views with preset filters.
| Field | Example | Description | Destination |
|---|---|---|---|
| Card Header | Node a0421 Alex A40 | Hostname and Cluster | Node View |
| Job Indicator | Exclusive | Indicates the joba nd metric states via keywords, see below | - |
| State Indicator | Allocated | Indicates the host state via keywords, see below | - |
| Activity | 2 Jobs | Number of Jobs currently running on host | Job List |
| Users | 2 Users | Number and IDs of users currently running jobs | User Table |
| Projects | 1 Project | Number and IDs of projects currently running jobs | Project Table |
In order to give an idea of the current job states, the following indicators are possible for the job indicator:
| Job Indicator | Type | Description |
|---|---|---|
| Fetching | Info | Data for selected metrics is currently fetched from the backend metric store. |
| Missing Metrics | Warning | At least one of the selected metrics does not return data successfully. Can hint to configuration problems. |
| No Metrics | Error | None of the selected metrics return data successfully. Node could be offline or misconfigured. |
| Exclusive | Job-Info | One exclusive job is currently running, utilizing all of the nodes’ hardware. |
| Shared | Job-Info | One or more shared jobs are currently running, utilizing allocated amounts of the nodes’ hardware. |
| Running | Job-Info | If more jobs than one are running, but all jobs are marked as ’exclusive’, this fallback is used. |
| None | Job-Info | No currently active jobs. |
The node hardware states are shown as reported by the scheduler and adapter interface. The following indicators are possible for the node state indicator:
| Node Indicator | Color | Description |
|---|---|---|
| Allocated | The node has been allocated to one or more jobs. | |
| Reserved | The node is in an advanced reservation and not generally available. | |
| Idle | The node is not allocated to any jobs and is available for use. | |
| Mixed | The node has some of its CPUs allocated while others are idle. | |
| Down | The node is unavailable for use. Nodes report this state if some failure occurs. | |
| Unknown | The scheduler has just started and the node’s state has not yet been determined. | |
| Not in DB | The node not known in database, but returned metric data. |
List Selection Bar

Nodes List Header Options.
The selection header allows for configuration of the displayed data in terms of selected metrics or timerange.
| Field | Example | Description | |
|---|---|---|---|
| Metrics | 4 Selected | Menu for and Number of Metrics currently selected. | |
| Resolution | 600 | Resolution of the metric plots rendered for each node. | |
| Find Node(s) | a0421 | Filter for hostnames | |
| State | idle | Filter the node table by last reported node state. | |
| Range | Last 12hrs | Time range to be displayed as X-Axis. | |
| Refresh | 60 Seconds | Enable automatic refresh of metric plots. |
Extended Legend

Nodes List Extended Legend. Usernames and Job-IDs are shown in addition to the Resource-ID for shared resources.
For nodes with multiple jobs running on them, accelerator metrics are extended by the username and the job-id currently utilizing this hardware ID. This is based on the ID information sent during job-start to cc-backend (Database resources-column).
8.5.10 - Node

Node View. This example shows the last twelve hours of all metrics of the specified node ‘a0122’. The metric ‘acc_mem_used’ has an average below the configured ‘alert’ threshold, and is colored in red.
The node view is always called in respect to one specified cluster and one specified node (host). It displays the current state of all metrics for that node, rendered in form of metric plots, and independent of job meta data, i.e. without consideration for job start and end timestamps.
Selection Bar
Information and selections regarding the data of the plots rendered in the node table can be performed here:
- Name: The hostname of the selected node
- Node State: Currently reported node state
- Activity: Number of jobs currently allocated to this node. Exclusively used nodes will always display
1if a job is running at the moment, or0if not.- The “Show List”-Bitton leads to the joblist with preset filter fetching only currently allocated jobs on this node.
- Displayed Timerange: Select the timeframe to be rendered in the node table
Custom: Select timestampfromandtoin which the data should be fetched. It is possible to select date and time.15 Minutes, 30 Minutes, 1 Hour, 2 Hours, 4 Hours, 12 Hours, 24 Hours
- (Periodic) Reload: Force reload of fresh data from the backend or set a periodic reload in specified intervals
30 Seconds, 60 Seconds, 120 Seconds, 5 Minutes
The node hardware states are shown as reported by the scheduler and adapter interface. The following indicators are possible for the node state indicator:
| Node Indicator | Color | Description |
|---|---|---|
| Allocated | The node has been allocated to one or more jobs. | |
| Reserved | The node is in an advanced reservation and not generally available. | |
| Idle | The node is not allocated to any jobs and is available for use. | |
| Mixed | The node has some of its CPUs allocated while others are idle. | |
| Down | The node is unavailable for use. Nodes report this state if some failure occurs. | |
| Unknown | The scheduler has just started and the node’s state has not yet been determined. | |
| Not in DB | The node not known in database, but returned metric data. |
Node Table
Metrics are ordered alphanumerically in this table, rendering each metric in the selected timeframe.
8.5.11 - Analysis

Analysis View General Information Section. Two filters are active, the pie chart displays top user node hour utilization fractions.
The analysis view is always called in respect to one specified cluster. It collects and renders data based on the jobs returned by the active filters, which can be specified to a high detail, allowing analysis of specific aspects.
General Information
The general information section of the analysis view is always rendered and consists of the following elements
Totals
Total counts of collected data based on the returned jobs matching the requested filters:
- Total Jobs
- Total Short Jobs (as defined by the configuration, default: less than 5 minute runtime)
- Total Walltime
- Total Node Hours
- Total Core Hours
- Total Accelerator Hours
Top Users and Projects
The ten most active users or projects are rendered in a combination of pie chart and tabular legend with values displayed. By default, the top ten users with the most jobs matching the selected filters will be shown.
Hovering over one of the pie chart fractions will display a legend featuring the identifier and value of the selected parameter.
The selection can be changed directly in the headers of the pie chart and the table, and can be changed to
| Element | Options |
|---|---|
| Pie Chart | Users, Projects |
| Table | Walltime, Node Hours, Core Hours, Accelerator Hours |
The selection is saved for each user and cluster, and will select the last chosen types of list as default the next time this view is opened.
“User Names” and “Project Codes” are rendered as links, leading to user job lists or project job lists with preset filters for cluster and entity ID.
Heatmap Roofline
A roofline plot representing the utilization of available resources as the relation between computation and memory for all jobs matching the filters. In order to represent the data in a meaningful way, the time information of the raw data is abstracted and represented as a heat map, with increasingly red sections of the roofline plot being the most populated regions of utilization.
Histograms
Two histograms depicting the duration and number of allocated cores distributions for the returned jobs matching the filters.
Selectable Data Representations

The second half of the analysis view consists of areas reserved for rendering user-selected data representations.
- Select Plots for Histograms: Opens a selector listing all configured metrics of the respective cluster. One or more metrics can be selected, and the data returned will be rendered as average distributions normalized by node hours (core hours, accelerator hours; depending on the metric).
- Select Plots in Scatter Plots: Opens a selector which allows selection of user chosen combinations of configured metrics for the respective cluster. Selected duplets will be rendered as scatter bubble plots for each selected pair of metrics.

Three pairs of metrics are already selected for scatter representation. Remove a selected pair by pressing the ‘x’ button, add a new pair by selecting two metric from the dropdown menu, and confirming by pressing ‘Add Plot’.
Average Distribution Histograms

Three selected metrics are represented as normalized, average distributions based on returned jobs.
These histograms show the distribution of the normalized averages of all jobs matching the filters, split into 50 bins for high detail.
Normalization is achieved by weighting the selected metric data job averages by node hours (default), or by either accelerator hours (for native accelerator scope metrics) or core hours (for native core scope metrics).
User Defined Scatterplots

Three user defined scatter plots.
Bubble scatter plots show the position of the averages of two selected metrics in relation to each other.
Each circle represents one job, while the size of a circle is proportional to its node hours. Darker circles mean multiple jobs have the same averages for the respective metric selection.
8.5.12 - Status
The status view is always called in respect to one specified cluster. It displays the current state of utilization of the respective clusters resources, as well as user and project top lists and distribution histograms of the allocated resources per job.
2 Minutes.Utilization Information

For each subluster, utilization is displayed in two parts rendered in one row.
Gauges
Simple gauge representation of the current utilization of available resources
| Field | Description | Note |
|---|---|---|
| Allocated Nodes | Number of nodes currently allocated in respect to maximum available | - |
| Flop Rate (Any) | Currently achieved flop rate in respect to theoretical maximum | Floprate calculated as f_any = (f_double x 2) + f_single |
| MemBW Rate | Currently achieved memory bandwidth in respect to technical maximum | - |
Roofline
A roofline plot representing the utilization of available resources as the relation between computation and memory for each currently allocated, running job at the time of the latest data retrieval. Therefore, no time information is represented (all dots in blue, representing one job each).
Top Users and Projects

The ten most active users or projects are rendered in a combination of pie chart and tabular legend. By default, the top ten users or projects with the most allocated, running jobs are listed.
The selection can be changed directly in the tables header at Number of ..., and can be changed to
- Jobs (Default)
- Nodes
- Cores
- Accelerators
The selection is saved for each user and cluster, and will select the last chosen type of list as default the next time this view is rendered.
Hovering over one of the pie chart fractions will display a legend featuring the identifier and value of the selected parameter.
“User Names” and “Project Codes” are rendered as links, leading to user job lists or project job lists with preset filters for cluster, entity ID, and state == running.
Statistic Histograms
Several histograms depicting the utilization of the clusters resources, based on all currently running jobs are rendered here:
- Duration Distribution
- Number of Nodes Distribution
- Number of Cores Distribution
- Number of Accelerators Distribution
Additional Histograms showing specified footprint metrics across all systems can be selected via the “Select histograms” menu next to the refresher tool.
footprint flag is set in the respective metrics’ configuration will be shown.Metric Status Tab
The status details panel contains a second tab labeled Metric Status that provides an overview of node health conditions across the cluster.
Node State Distribution
Two pie charts display the current distribution of:
- Scheduler States: The allocation state of nodes as reported by the scheduler (e.g.,
allocated,idle,down). - Health States: The metric monitoring health state of nodes (e.g.,
ok,warn,critical,unknown).
Each chart is paired with a summary table listing each state and the number of nodes in that state.
Node Health Table
A filterable table lists individual nodes with the following columns:
- Hostname: Node identifier, linked to the node detail view.
- Scheduler State: The current scheduler allocation state.
- Health State: The current metric monitoring health state.
- Faulty Metrics: List of metrics that are missing or reporting unhealthy values.
The table can be filtered by hostname, scheduler state, or health state using the filter inputs above each column.
9 - Contribution Guidelines
You can find a list with articles related to contributing to ClusterCockpit here.
9.1 - Commit message naming conventions
Introduction
ClusterCockpit uses goreleaser for building and uploading releases. In this process the release notes including all notable changes are automatically generated based on special commit message tags. Moreover GitHub will parse special characters and words to link and close issues.
Reference issue tickets
It is good practice to always create a ticket for notable changes.
This allows to comment and discuss about source code changes. Any commit that
contributes to the ticket should reference the ticket id (in the commit message
or description). This is achieved in GitHub by prefixing the ticket id with a
number sign character (#):
This change contributes to #235
GitHub will detect if a pull request or commit uses special keywords to close a ticket:
- close, closes, closed
- fix, fixes, fixed
- resolve, resolves, resolved
The ticket will not be closed before the commit appears on the main branch. Example:
This change fixes #423
Control release notes with preconfigured commit message prefixes
Commits with one of the following prefixes will appear in the release notes:
- feat: Mark a commit to contain changes related to new features
- fix: Mark a commit to contain changes related to bug fixes
- sec: Mark a commit to contain changes related to security fixes
- doc: Mark a commit to contain changes related to documentation updates
- [feat|fix] dep: Mark a commit that is related to a dependency introduction or change
9.2 - Contribute documentation
We use Hugo to format and generate our website, the Docsy theme for styling and site structure. Hugo is an open-source static site generator that provides us with templates, content organisation in a standard directory structure, and a website generation engine. You write the pages in Markdown (or HTML if you want), and Hugo wraps them up into a website.
All submissions, including submissions by project members, require review. We use GitHub pull requests for this purpose. Consult GitHub Help for more information on using pull requests.
Quick start
Here’s a quick guide to updating the docs. It assumes you’re familiar with the GitHub workflow and you’re happy to use the automated preview of your doc updates:
- Fork the cc-docs repo on GitHub.
- Make your changes and send a pull request (PR).
- If you’re not yet ready for a review, add “WIP” to the PR name to indicate it’s a work in progress.
- Preview the website locally as described beyond.
- Continue updating your doc and pushing your changes until you’re happy with the content.
- When you’re ready for a review, add a comment to the PR, and remove any “WIP” markers.
Updating a single page
If you’ve just spotted something you’d like to change while using the docs, Docsy has a shortcut for you:
- Click Edit this page in the top right hand corner of the page.
- If you don’t already have an up to date fork of the project repo, you are prompted to get one - click Fork this repository and propose changes or Update your Fork to get an up to date version of the project to edit. The appropriate page in your fork is displayed in edit mode.
Previewing your changes locally
If you want to run your own local Hugo server to preview your changes as you work:
- Follow the instructions in Getting started to install Hugo and any other tools you need. You’ll need at least Hugo version 0.45 (we recommend using the most recent available version), and it must be the extended version, which supports SCSS.
- Fork the cc-docs repo into your own project, then create a local copy using
git clone. Don’t forget to use--recurse-submodulesor you won’t pull down some of the code you need to generate a working site.
git clone --recurse-submodules --depth 1 https://github.com/ClusterCockpit/cc-doc.git
- Run
hugo serverin the site root directory. By default your site will be available at http://localhost:1313/. Now that you’re serving your site locally, Hugo will watch for changes to the content and automatically refresh your site. - Continue with the usual GitHub workflow to edit files, commit them, push the changes up to your fork, and create a pull request.
Creating an issue
If you’ve found a problem in the docs, but you’re not sure how to fix it yourself, please create an issue in the cc-docs. You can also create an issue about a specific page by clicking the Create Issue button in the top right hand corner of the page.
Useful resources
- Docsy user guide: All about Docsy, including how it manages navigation, look and feel, and multi-language support.
- Hugo documentation: Comprehensive reference for Hugo.
- Github Hello World!: A basic introduction to GitHub concepts and workflow.
9.3 - Docsy example page
This is a placeholder page. Replace it with your own content.
Text can be bold, italic, or strikethrough. Links should be blue with no underlines (unless hovered over).
There should be whitespace between paragraphs. Vape migas chillwave sriracha poutine try-hard distillery. Tattooed shabby chic small batch, pabst art party heirloom letterpress air plant pop-up. Sustainable chia skateboard art party banjo cardigan normcore affogato vexillologist quinoa meggings man bun master cleanse shoreditch readymade. Yuccie prism four dollar toast tbh cardigan iPhone, tumblr listicle live-edge VHS. Pug lyft normcore hot chicken biodiesel, actually keffiyeh thundercats photo booth pour-over twee fam food truck microdosing banh mi. Vice activated charcoal raclette unicorn live-edge post-ironic. Heirloom vexillologist coloring book, beard deep v letterpress echo park humblebrag tilde.
90’s four loko seitan photo booth gochujang freegan tumeric listicle fam ugh humblebrag. Bespoke leggings gastropub, biodiesel brunch pug fashion axe meh swag art party neutra deep v chia. Enamel pin fanny pack knausgaard tofu, artisan cronut hammock meditation occupy master cleanse chartreuse lumbersexual. Kombucha kogi viral truffaut synth distillery single-origin coffee ugh slow-carb marfa selfies. Pitchfork schlitz semiotics fanny pack, ugh artisan vegan vaporware hexagon. Polaroid fixie post-ironic venmo wolf ramps kale chips.
There should be no margin above this first sentence.
Blockquotes should be a lighter gray with a border along the left side in the secondary color.
There should be no margin below this final sentence.
First Header 2
This is a normal paragraph following a header. Knausgaard kale chips snackwave microdosing cronut copper mug swag synth bitters letterpress glossier craft beer. Mumblecore bushwick authentic gochujang vegan chambray meditation jean shorts irony. Viral farm-to-table kale chips, pork belly palo santo distillery activated charcoal aesthetic jianbing air plant woke lomo VHS organic. Tattooed locavore succulents heirloom, small batch sriracha echo park DIY af. Shaman you probably haven’t heard of them copper mug, crucifix green juice vape single-origin coffee brunch actually. Mustache etsy vexillologist raclette authentic fam. Tousled beard humblebrag asymmetrical. I love turkey, I love my job, I love my friends, I love Chardonnay!
Deae legum paulatimque terra, non vos mutata tacet: dic. Vocant docuique me plumas fila quin afuerunt copia haec o neque.
On big screens, paragraphs and headings should not take up the full container width, but we want tables, code blocks and similar to take the full width.
Scenester tumeric pickled, authentic crucifix post-ironic fam freegan VHS pork belly 8-bit yuccie PBR&B. I love this life we live in.
Second Header 2
This is a blockquote following a header. Bacon ipsum dolor sit amet t-bone doner shank drumstick, pork belly porchetta chuck sausage brisket ham hock rump pig. Chuck kielbasa leberkas, pork bresaola ham hock filet mignon cow shoulder short ribs biltong.
Header 3
This is a code block following a header.
Next level leggings before they sold out, PBR&B church-key shaman echo park. Kale chips occupy godard whatever pop-up freegan pork belly selfies. Gastropub Belinda subway tile woke post-ironic seitan. Shabby chic man bun semiotics vape, chia messenger bag plaid cardigan.
Header 4
- This is an unordered list following a header.
- This is an unordered list following a header.
- This is an unordered list following a header.
Header 5
- This is an ordered list following a header.
- This is an ordered list following a header.
- This is an ordered list following a header.
Header 6
| What | Follows |
|---|---|
| A table | A header |
| A table | A header |
| A table | A header |
There’s a horizontal rule above and below this.
Here is an unordered list:
- Liverpool F.C.
- Chelsea F.C.
- Manchester United F.C.
And an ordered list:
- Michael Brecker
- Seamus Blake
- Branford Marsalis
And an unordered task list:
- Create a Hugo theme
- Add task lists to it
- Take a vacation
And a “mixed” task list:
- Pack bags
- ?
- Travel!
And a nested list:
- Jackson 5
- Michael
- Tito
- Jackie
- Marlon
- Jermaine
- TMNT
- Leonardo
- Michelangelo
- Donatello
- Raphael
Definition lists can be used with Markdown syntax. Definition headers are bold.
- Name
- Godzilla
- Born
- 1952
- Birthplace
- Japan
- Color
- Green
Tables should have bold headings and alternating shaded rows.
| Artist | Album | Year |
|---|---|---|
| Michael Jackson | Thriller | 1982 |
| Prince | Purple Rain | 1984 |
| Beastie Boys | License to Ill | 1986 |
If a table is too wide, it should scroll horizontally.
| Artist | Album | Year | Label | Awards | Songs |
|---|---|---|---|---|---|
| Michael Jackson | Thriller | 1982 | Epic Records | Grammy Award for Album of the Year, American Music Award for Favorite Pop/Rock Album, American Music Award for Favorite Soul/R&B Album, Brit Award for Best Selling Album, Grammy Award for Best Engineered Album, Non-Classical | Wanna Be Startin’ Somethin’, Baby Be Mine, The Girl Is Mine, Thriller, Beat It, Billie Jean, Human Nature, P.Y.T. (Pretty Young Thing), The Lady in My Life |
| Prince | Purple Rain | 1984 | Warner Brothers Records | Grammy Award for Best Score Soundtrack for Visual Media, American Music Award for Favorite Pop/Rock Album, American Music Award for Favorite Soul/R&B Album, Brit Award for Best Soundtrack/Cast Recording, Grammy Award for Best Rock Performance by a Duo or Group with Vocal | Let’s Go Crazy, Take Me With U, The Beautiful Ones, Computer Blue, Darling Nikki, When Doves Cry, I Would Die 4 U, Baby I’m a Star, Purple Rain |
| Beastie Boys | License to Ill | 1986 | Mercury Records | noawardsbutthistablecelliswide | Rhymin & Stealin, The New Style, She’s Crafty, Posse in Effect, Slow Ride, Girls, (You Gotta) Fight for Your Right, No Sleep Till Brooklyn, Paul Revere, Hold It Now, Hit It, Brass Monkey, Slow and Low, Time to Get Ill |
Code snippets like var foo = "bar"; can be shown inline.
Also, this should vertically align with thisand this.
Code can also be shown in a block element.
foo := "bar";
bar := "foo";
Code can also use syntax highlighting.
func main() {
input := `var foo = "bar";`
lexer := lexers.Get("javascript")
iterator, _ := lexer.Tokenise(nil, input)
style := styles.Get("github")
formatter := html.New(html.WithLineNumbers())
var buff bytes.Buffer
formatter.Format(&buff, style, iterator)
fmt.Println(buff.String())
}
Long, single-line code blocks should not wrap. They should horizontally scroll if they are too long. This line should be long enough to demonstrate this.
Inline code inside table cells should still be distinguishable.
| Language | Code |
|---|---|
| Javascript | var foo = "bar"; |
| Ruby | foo = "bar"{ |
Small images should be shown at their actual size.

Large images should always scale down and fit in the content container.

The photo above of the Spruce Picea abies shoot with foliage buds: Bjørn Erik Pedersen, CC-BY-SA.
Components
Alerts
Note
This is an alert with a title.Note
This is an alert with a title and Markdown.Warning
This is a warning with a title.Another Heading
Add some sections here to see how the ToC looks like. Bacon ipsum dolor sit amet t-bone doner shank drumstick, pork belly porchetta chuck sausage brisket ham hock rump pig. Chuck kielbasa leberkas, pork bresaola ham hock filet mignon cow shoulder short ribs biltong.
This Document
Inguina genus: Anaphen post: lingua violente voce suae meus aetate diversi. Orbis unam nec flammaeque status deam Silenum erat et a ferrea. Excitus rigidum ait: vestro et Herculis convicia: nitidae deseruit coniuge Proteaque adiciam eripitur? Sitim noceat signa probat quidem. Sua longis fugatis quidem genae.
Pixel Count
Tilde photo booth wayfarers cliche lomo intelligentsia man braid kombucha vaporware farm-to-table mixtape portland. PBR&B pickled cornhole ugh try-hard ethical subway tile. Fixie paleo intelligentsia pabst. Ennui waistcoat vinyl gochujang. Poutine salvia authentic affogato, chambray lumbersexual shabby chic.
Contact Info
Plaid hell of cred microdosing, succulents tilde pour-over. Offal shabby chic 3 wolf moon blue bottle raw denim normcore poutine pork belly.
External Links
Stumptown PBR&B keytar plaid street art, forage XOXO pitchfork selvage affogato green juice listicle pickled everyday carry hashtag. Organic sustainable letterpress sartorial scenester intelligentsia swag bushwick. Put a bird on it stumptown neutra locavore. IPhone typewriter messenger bag narwhal. Ennui cold-pressed seitan flannel keytar, single-origin coffee adaptogen occupy yuccie williamsburg chillwave shoreditch forage waistcoat.
This is the final element on the page and there should be no margin below this.
9.4 - Tips for cc-backend frontend development
ClusterCockpit web frontend
The frontend assets including the Svelte js files are per default embedded in
the go binary. To enable a quick turnaround cycle for web development of the
frontend disable embedding of static assets in config.json:
"embed-static-files": false,
"static-files": "./web/frontend/public/",
Start the node build process (in directory ./web/frontend) in development mode:
> npm run dev
This will start the build process in listen mode. Whenever you change a source
files the depending javascript targets will be automatically rebuild.
In case the javascript files are minified you may need to set the production
flag by hand to false in ./web/frontend/rollup.config.mjs:
const production = false
Usually this should work automatically.
Because the files are still served by ./cc-backend you have to reload the view explicitly in your browser.
A common setup is to have three terminals open:
- One running cc-backend (working directory repository root):
./cc-backend -server -dev - Another running npm in developer mode (working directory
./web/frontend):npm run dev - And the last one editing the frontend source files
9.5 - How to prepare a new release
Steps to prepare a release
On
hotfixbranch:- Update ReleaseNotes.md
- Update version in Makefile
- Commit, push, and pull request
- Merge in master
On Linux host:
- Pull master
- Ensure that GitHub Token environment variable
GITHUB_TOKENis set - Create release tag:
git tag v1.1.0 -m release - Execute
goreleaser release
9.6 - Unit tests
Overview
We use the standard golang testing environment.
The following conventions are used:
- White box unit tests: Tests for internal functionality are placed in files
- Black box unit tests: Tests for public interfaces are placed in files
with
<package name>_test.goand belong to the package<package_name>_test. There only exists one package test file per package. - Integration tests: Tests that use multiple componenents are placed in a
package test file. These are named
<package name>_test.goand belong to the package<package_name>_test. - Test assets: Any required files are placed in a directory
./testdatawithin each package directory.
Executing tests
Visual Studio Code has a very good golang test integration. For debugging a test this is the recommended solution.
The Makefile provided by us has a test target that executes:
> go clean -testcache
> go build ./...
> go vet ./...
> go test ./...
Of course the commands can also be used on the command line. For details about golang testing refer to the standard documentation: